
The Goldman Sachs Group, Inc. (GS) FY2026 Q2 Balance Sheet
As of 2026-06-30
Balance Sheet
As of 2026-06-30
Swipe to see the full flow
Chart details
The Goldman Sachs Group, Inc. (GS) FY2026 Q2 Balance Sheet
Balance sheet as of 2026-06-30. The chart shows assets, liabilities and equity at that date.
- Assets
- 2,127,711,000,000 US dollars
- Liabilities
- 2,004,969,000,000 US dollars
- Equity
- 122,742,000,000 US dollars
- Trading assets (at fair value and includes $185,318 and $158,641 pledged as collateral)
- 789,083,000,000 US dollars
- Loans (net of allowance of $2,188 and $2,148, and includes $4,640 and $4,905 at fair value)
- 260,888,000,000 US dollars
- Securities borrowed (includes $61,756 and $51,581 at fair value)
- 244,599,000,000 US dollars
- Customer and other receivables (includes $292 and $315 at fair value)
- 230,286,000,000 US dollars
- Cash and cash equivalents
- 187,266,000,000 US dollars
- Available-for-sale securities (at fair value; amortized cost of $156,636 and $99,116)
- 155,636,000,000 US dollars
- Securities purchased under agreements to resell (includes $121,206 and $126,007 at fair value)
- 121,224,000,000 US dollars
- Held-to-maturity securities
- 74,658,000,000 US dollars
- Other assets (includes $202 and $180 at fair value)
- 38,740,000,000 US dollars
- Other investments (includes $24,343 and $24,938 at fair value)
- 25,331,000,000 US dollars
- Deposits (includes $90,249 and $76,569 at fair value)
- 557,955,000,000 US dollars
- Unsecured long-term borrowings (includes $144,703 and $112,683 at fair value)
- 347,963,000,000 US dollars
- Trading liabilities (at fair value)
- 323,783,000,000 US dollars
- Customer and other payables
- 300,057,000,000 US dollars
- Securities sold under agreements to repurchase (at fair value)
- 266,855,000,000 US dollars
- Unsecured short-term borrowings
- 89,911,000,000 US dollars
- Securities loaned (includes $12,871 and $11,995 at fair value)
- 55,638,000,000 US dollars
- Other secured financings (includes $34,865 and $27,833 at fair value)
- 35,081,000,000 US dollars
- Other liabilities (includes $264 and $111 at fair value)
- 27,726,000,000 US dollars
- Retained earnings
- 174,352,000,000 US dollars
- Additional paid-in capital
- 62,122,000,000 US dollars
- Preferred stock; aggregate liquidation preference of $13,028 and $15,153
- 13,028,000,000 US dollars
- Share-based awards
- 6,038,000,000 US dollars
- Common stock; 936,341,620 and 931,995,446 shares issued, and 291,442,355 and 296,476,742 shares outstanding
- 9,000,000 US dollars
- Nonvoting common stock; no shares issued and outstanding
- 0 US dollars
- Stock held in treasury, at cost; 644,899,267 and 635,518,706 shares
- negative 129,951,000,000 US dollars
- Accumulated other comprehensive loss
- negative 2,856,000,000 US dollars
- Gross equity (calculated)
- 255,549,000,000 US dollars. Net equity plus the magnitudes of its negative contributions equals gross positive equity. The negative contributions enter this reconciliation as add-backs; their filed signs stay negative.
Chart connections
- Assets equal liabilities plus consolidated equity. Consolidated equity includes noncontrolling interests when reported.
- Treasury shares and other negative equity contributions reduce equity.
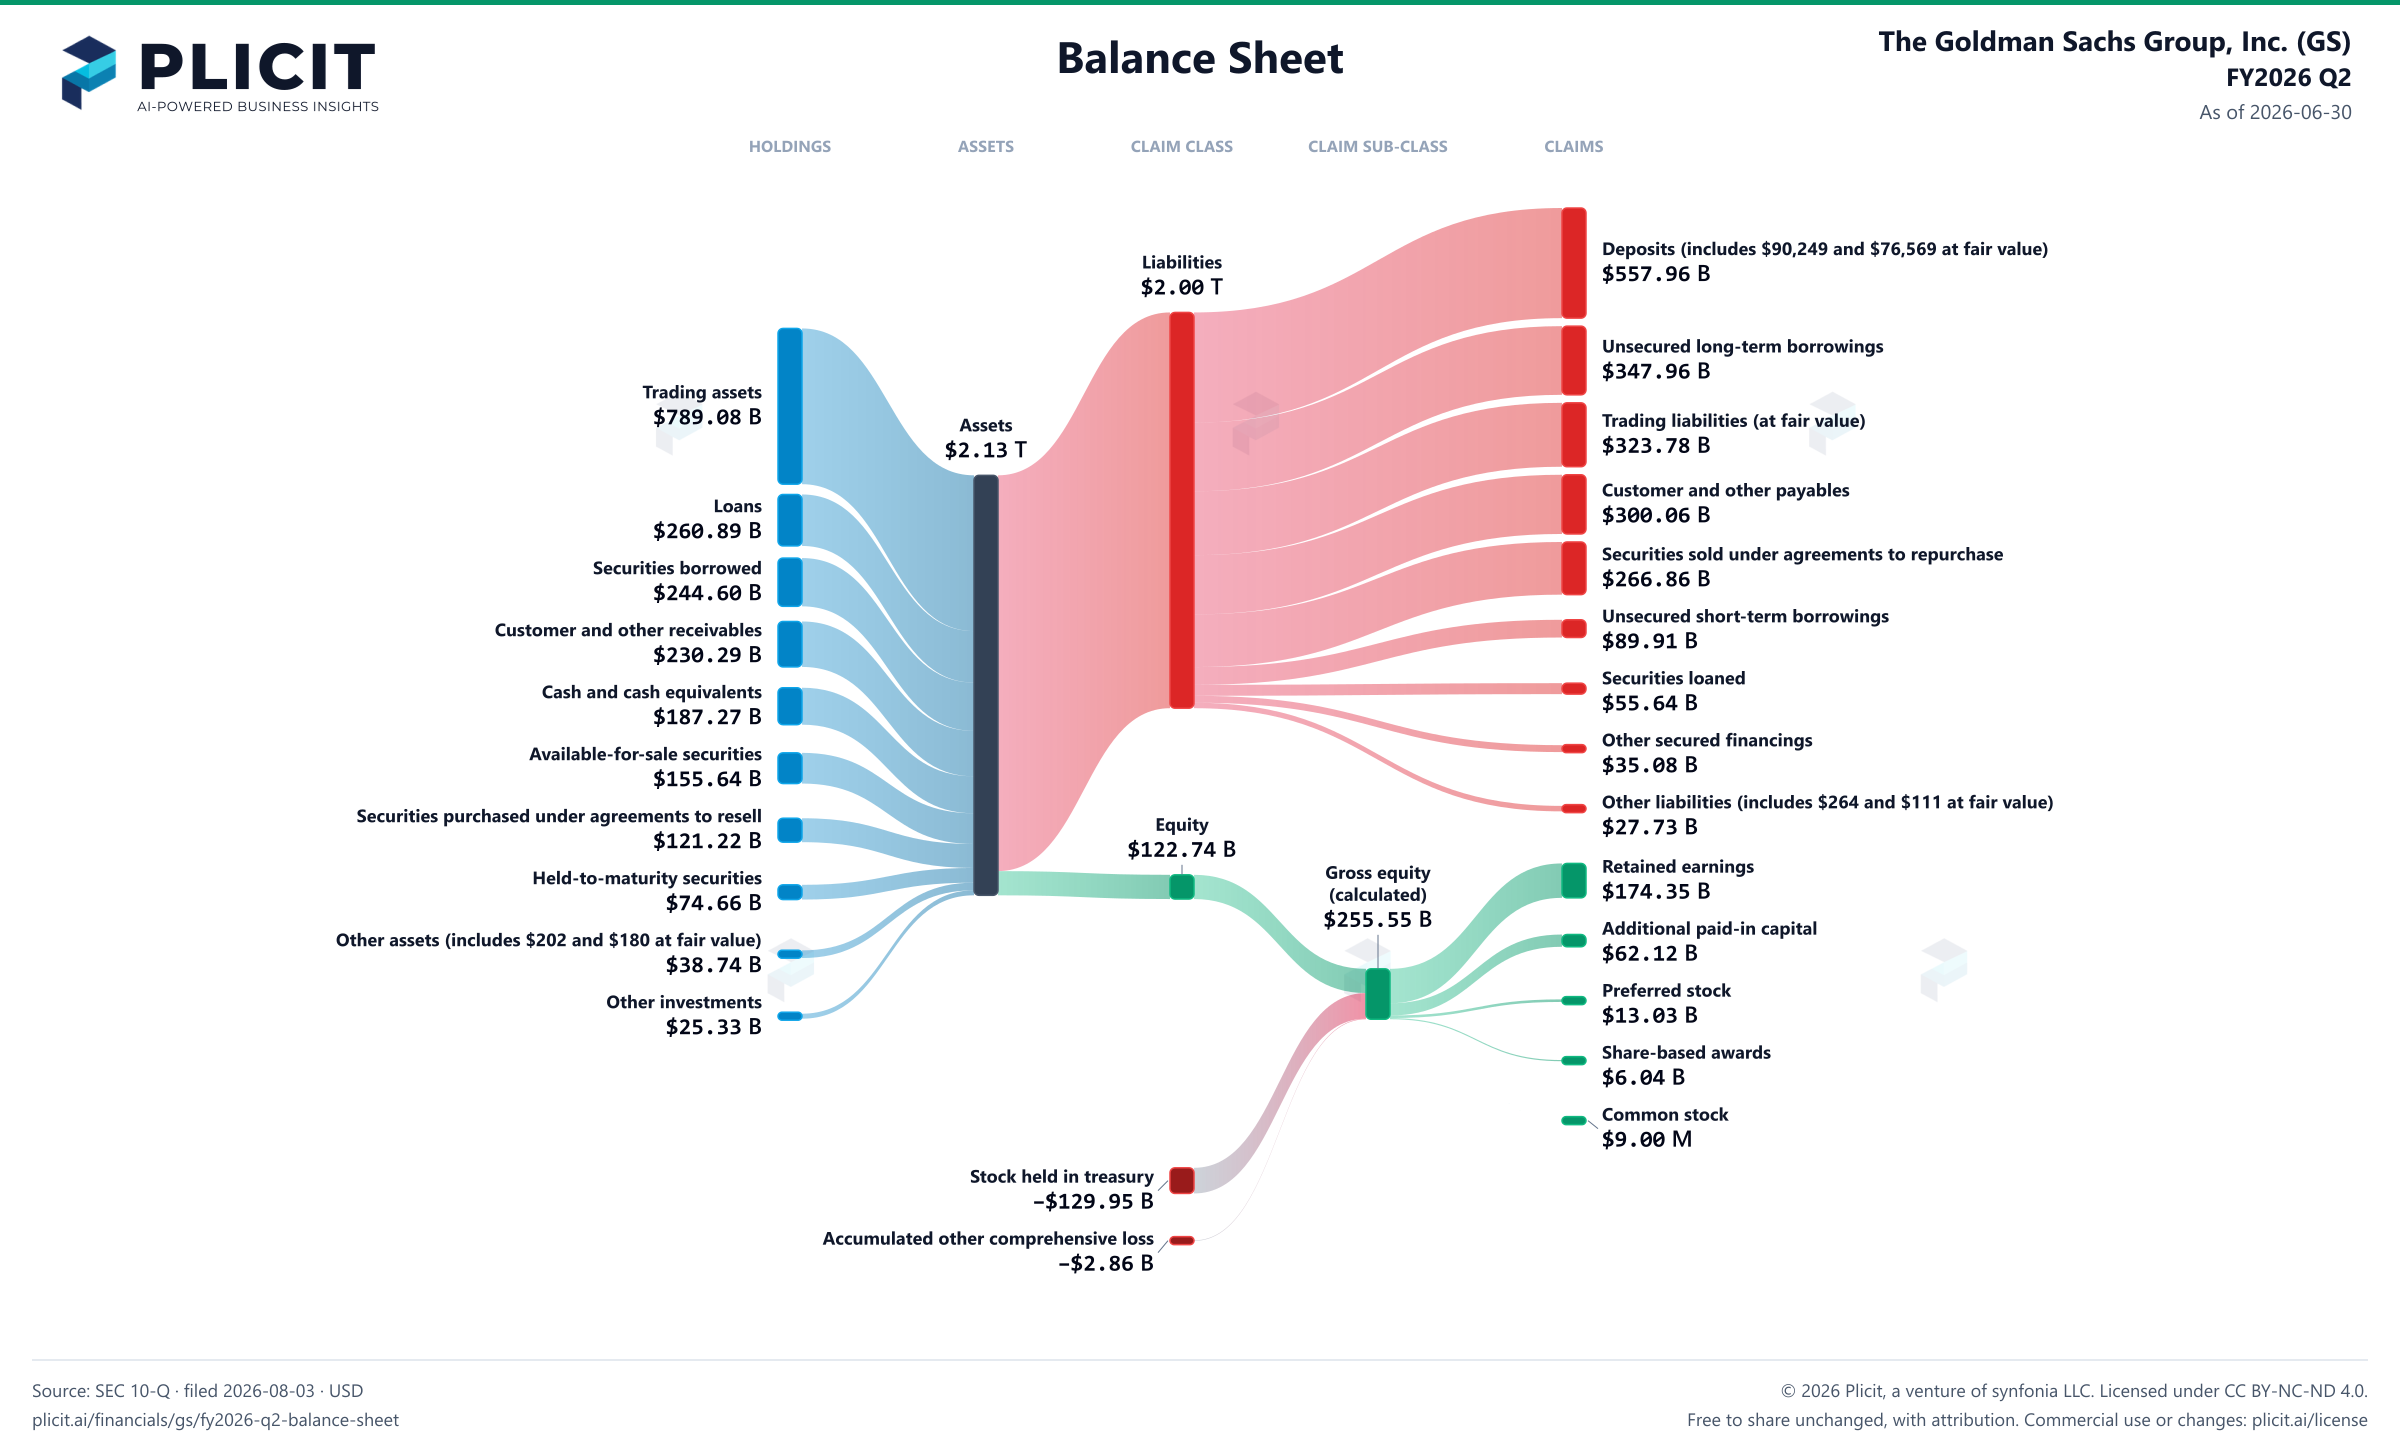
Free to share unchanged, with credit to Plicit.ai · CC BY-NC-ND 4.0Download PNG
Product waitlist
Health Check and Teardown for your own company
A health check uncovers insights of your private books, not a public ticker. Join this list to get notified as soon as we go-live!