
HORMEL FOODS CORPORATION (HRL) FY2026 Q3 Balance Sheet
As of 2026-07-26
Balance Sheet
As of 2026-07-26
Swipe to see the full flow
Chart details
HORMEL FOODS CORPORATION (HRL) FY2026 Q3 Balance Sheet
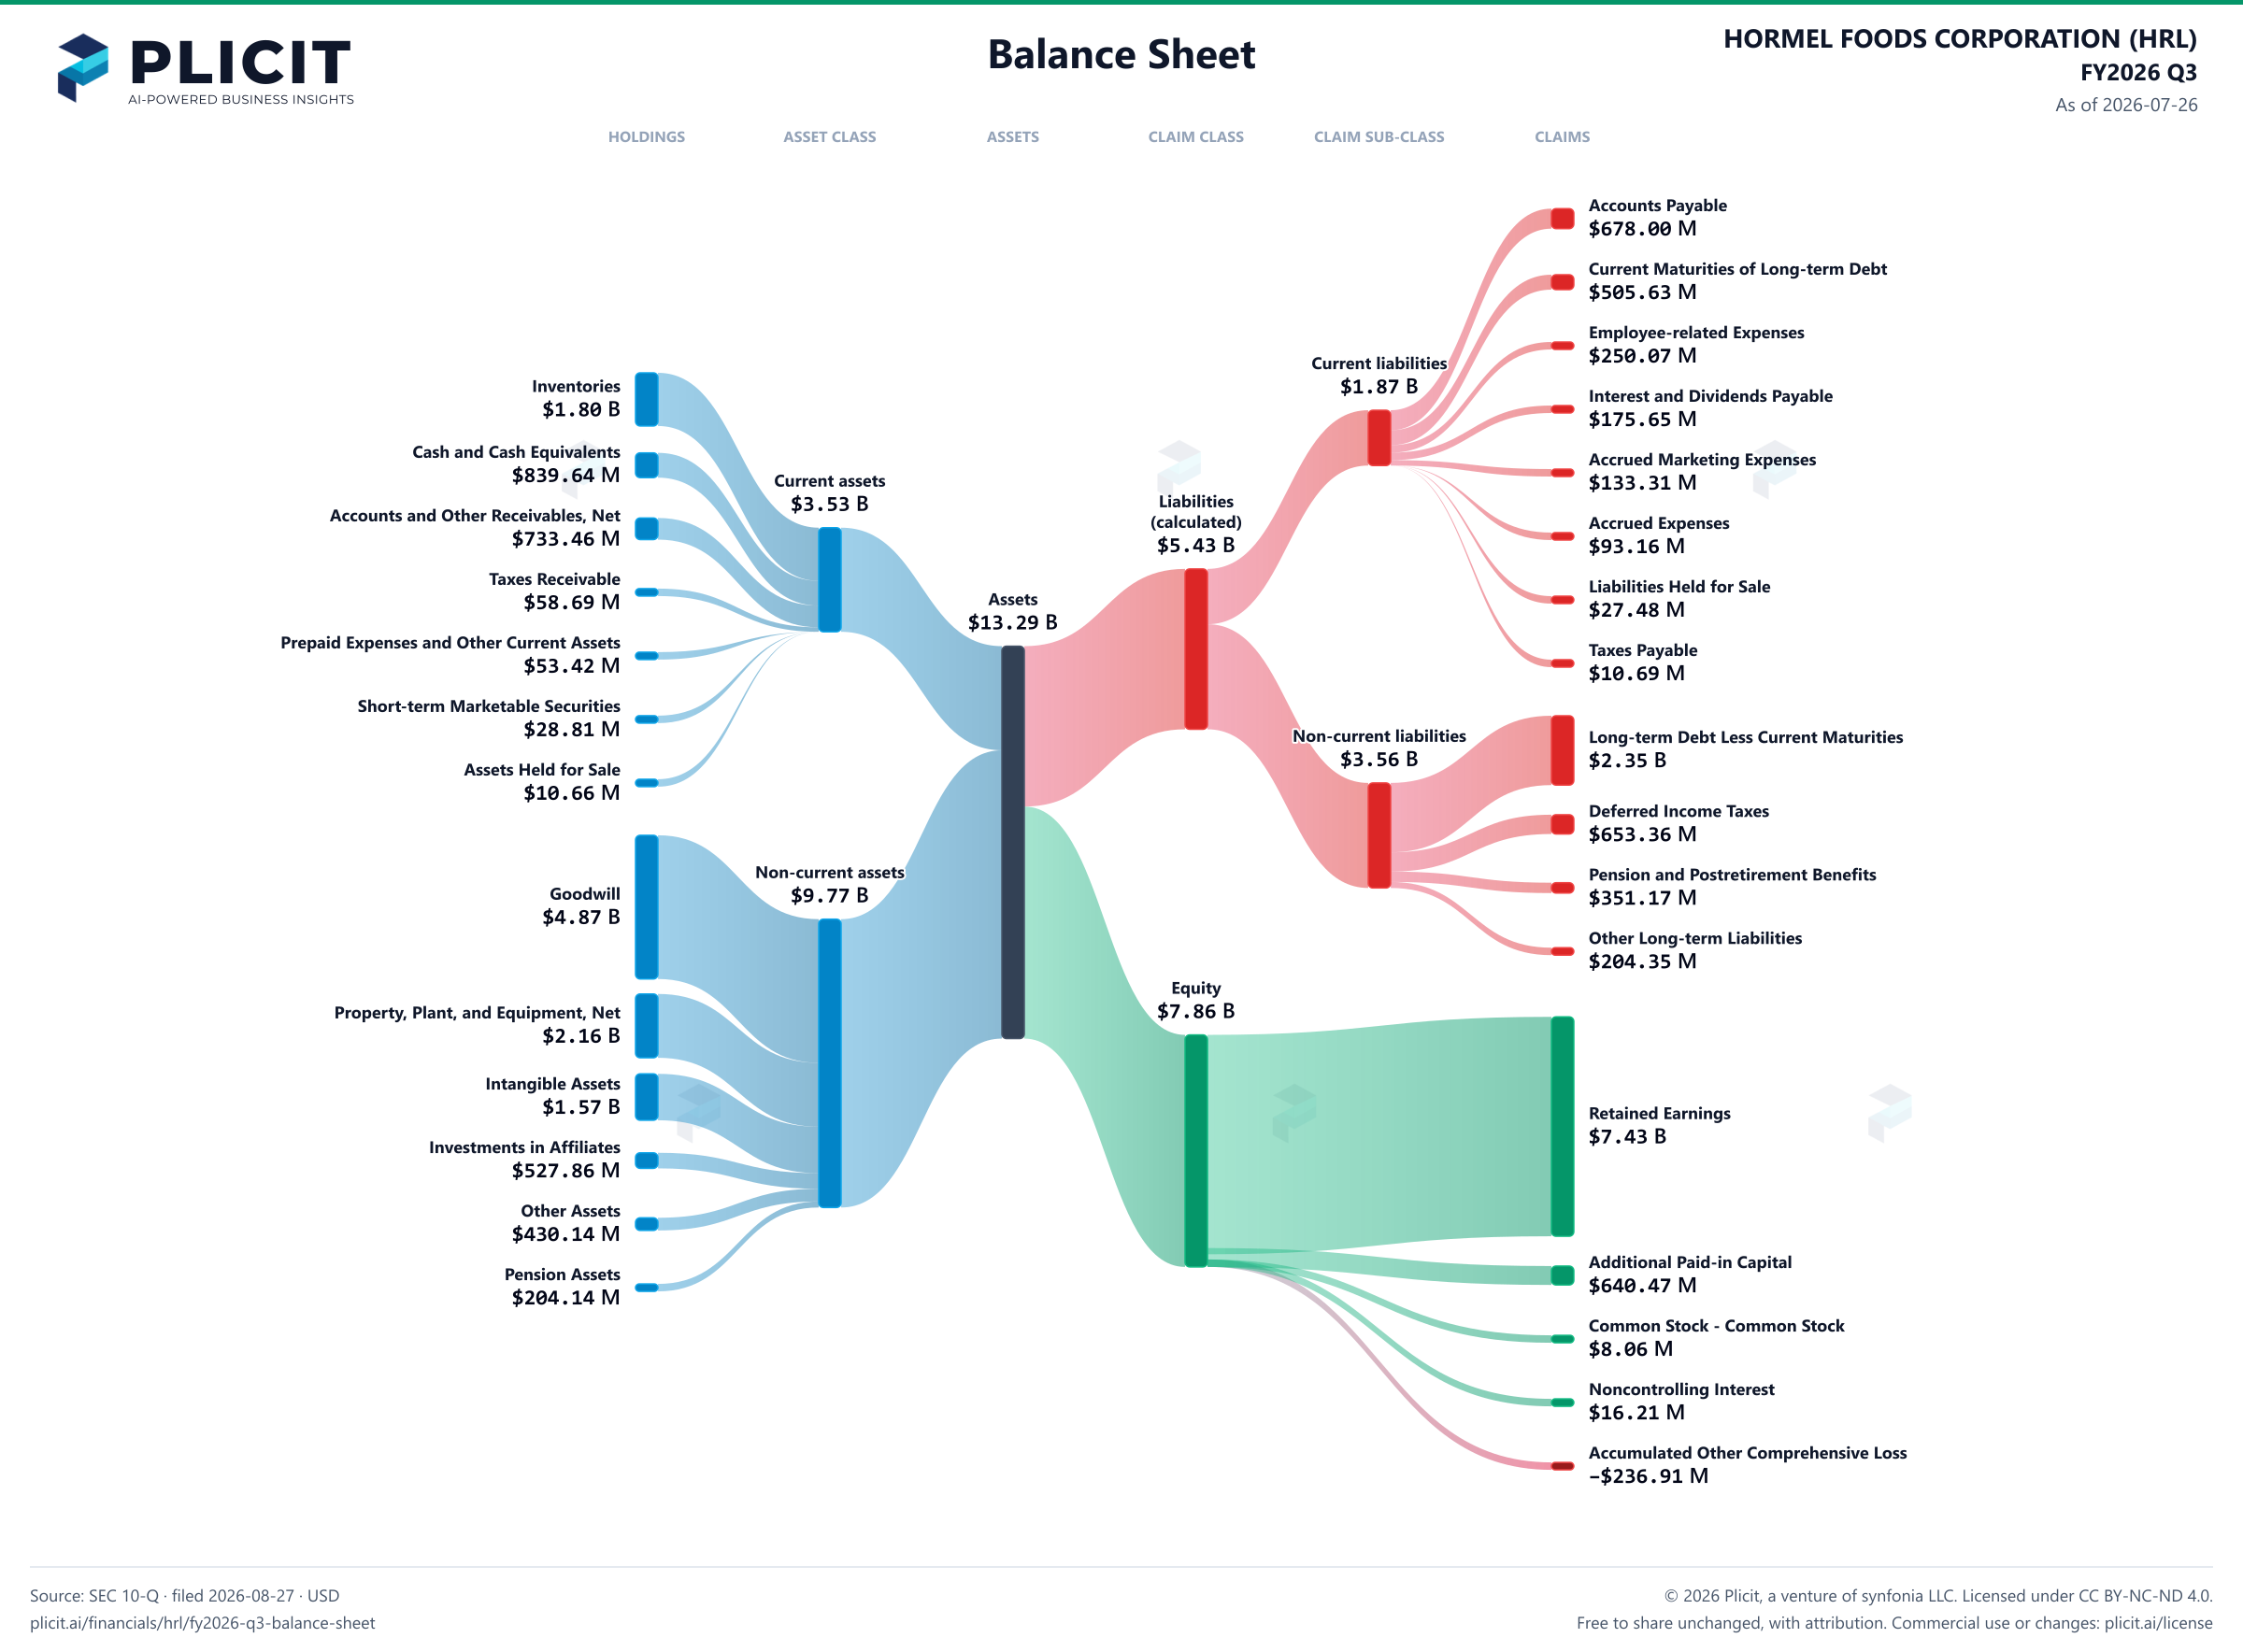
Balance sheet as of 2026-07-26. The chart shows assets, liabilities and equity at that date.
- Assets
- 13,292,014,000 US dollars
- Current assets
- 3,526,238,000 US dollars
- Non-current assets
- 9,765,776,000 US dollars
- Liabilities (calculated)
- 5,432,360,000 US dollars
- Current liabilities
- 1,873,991,000 US dollars
- Non-current liabilities
- 3,558,369,000 US dollars
- Equity
- 7,859,654,000 US dollars
- Noncontrolling interest
- 16,210,000 US dollars. Included in consolidated equity; this amount is not added again.
- Inventories
- 1,801,567,000 US dollars
- Cash and Cash Equivalents
- 839,639,000 US dollars
- Accounts and Other Receivables, Net
- 733,460,000 US dollars
- Taxes Receivable
- 58,688,000 US dollars
- Prepaid Expenses and Other Current Assets
- 53,420,000 US dollars
- Short-term Marketable Securities
- 28,807,000 US dollars
- Assets Held for Sale
- 10,659,000 US dollars
- Goodwill
- 4,867,763,000 US dollars
- Property, Plant, and Equipment, Net
- 2,163,025,000 US dollars
- Intangible Assets
- 1,572,850,000 US dollars
- Investments in Affiliates
- 527,864,000 US dollars
- Other Assets
- 430,139,000 US dollars
- Pension Assets
- 204,135,000 US dollars
- Accounts Payable
- 677,999,000 US dollars
- Current Maturities of Long-term Debt
- 505,634,000 US dollars
- Employee-related Expenses
- 250,072,000 US dollars
- Interest and Dividends Payable
- 175,646,000 US dollars
- Accrued Marketing Expenses
- 133,313,000 US dollars
- Accrued Expenses
- 93,155,000 US dollars
- Liabilities Held for Sale
- 27,483,000 US dollars
- Taxes Payable
- 10,690,000 US dollars
- Long-term Debt Less Current Maturities
- 2,349,489,000 US dollars
- Deferred Income Taxes
- 653,360,000 US dollars
- Pension and Postretirement Benefits
- 351,174,000 US dollars
- Other Long-term Liabilities
- 204,345,000 US dollars
- Retained Earnings
- 7,431,817,000 US dollars
- Additional Paid-in Capital
- 640,472,000 US dollars
- Common Stock - Common Stock
- 8,063,000 US dollars
- Preferred Stock
- 0 US dollars
- Common Stock - Common Stock, Nonvoting
- 0 US dollars
- Noncontrolling Interest
- 16,210,000 US dollars
- Accumulated Other Comprehensive Loss
- negative 236,907,000 US dollars
Chart connections
- Assets equal liabilities plus consolidated equity. Consolidated equity includes noncontrolling interests when reported.
- Treasury shares and other negative equity contributions reduce equity.
- The filed current assets lines add up to $3,526,240.00 K and the current assets total is $3,526,238.00 K; the $2.00 K difference is within the rounding of the filed amounts.
- The filed current liabilities lines add up to $1,873,992.00 K and the current liabilities total is $1,873,991.00 K; the $1.00 K difference is within the rounding of the filed amounts.
- The filed non-current liabilities lines add up to $3,558,368.00 K and the non-current liabilities total is $3,558,369.00 K; the $1.00 K difference is within the rounding of the filed amounts.
- The filed equity lines add up to $7,859,655.00 K and the equity total is $7,859,654.00 K; the $1.00 K difference is within the rounding of the filed amounts.
Free to share unchanged, with credit to Plicit.ai · CC BY-NC-ND 4.0Download PNG
Product waitlist
Health Check and Teardown for your own company
A health check uncovers insights of your private books, not a public ticker. Join this list to get notified as soon as we go-live!