
Ionis Pharmaceuticals, Inc. (IONS) FY2026 Q2 Balance Sheet
As of 2026-06-30
Balance Sheet
As of 2026-06-30
Swipe to see the full flow
Chart details
Ionis Pharmaceuticals, Inc. (IONS) FY2026 Q2 Balance Sheet
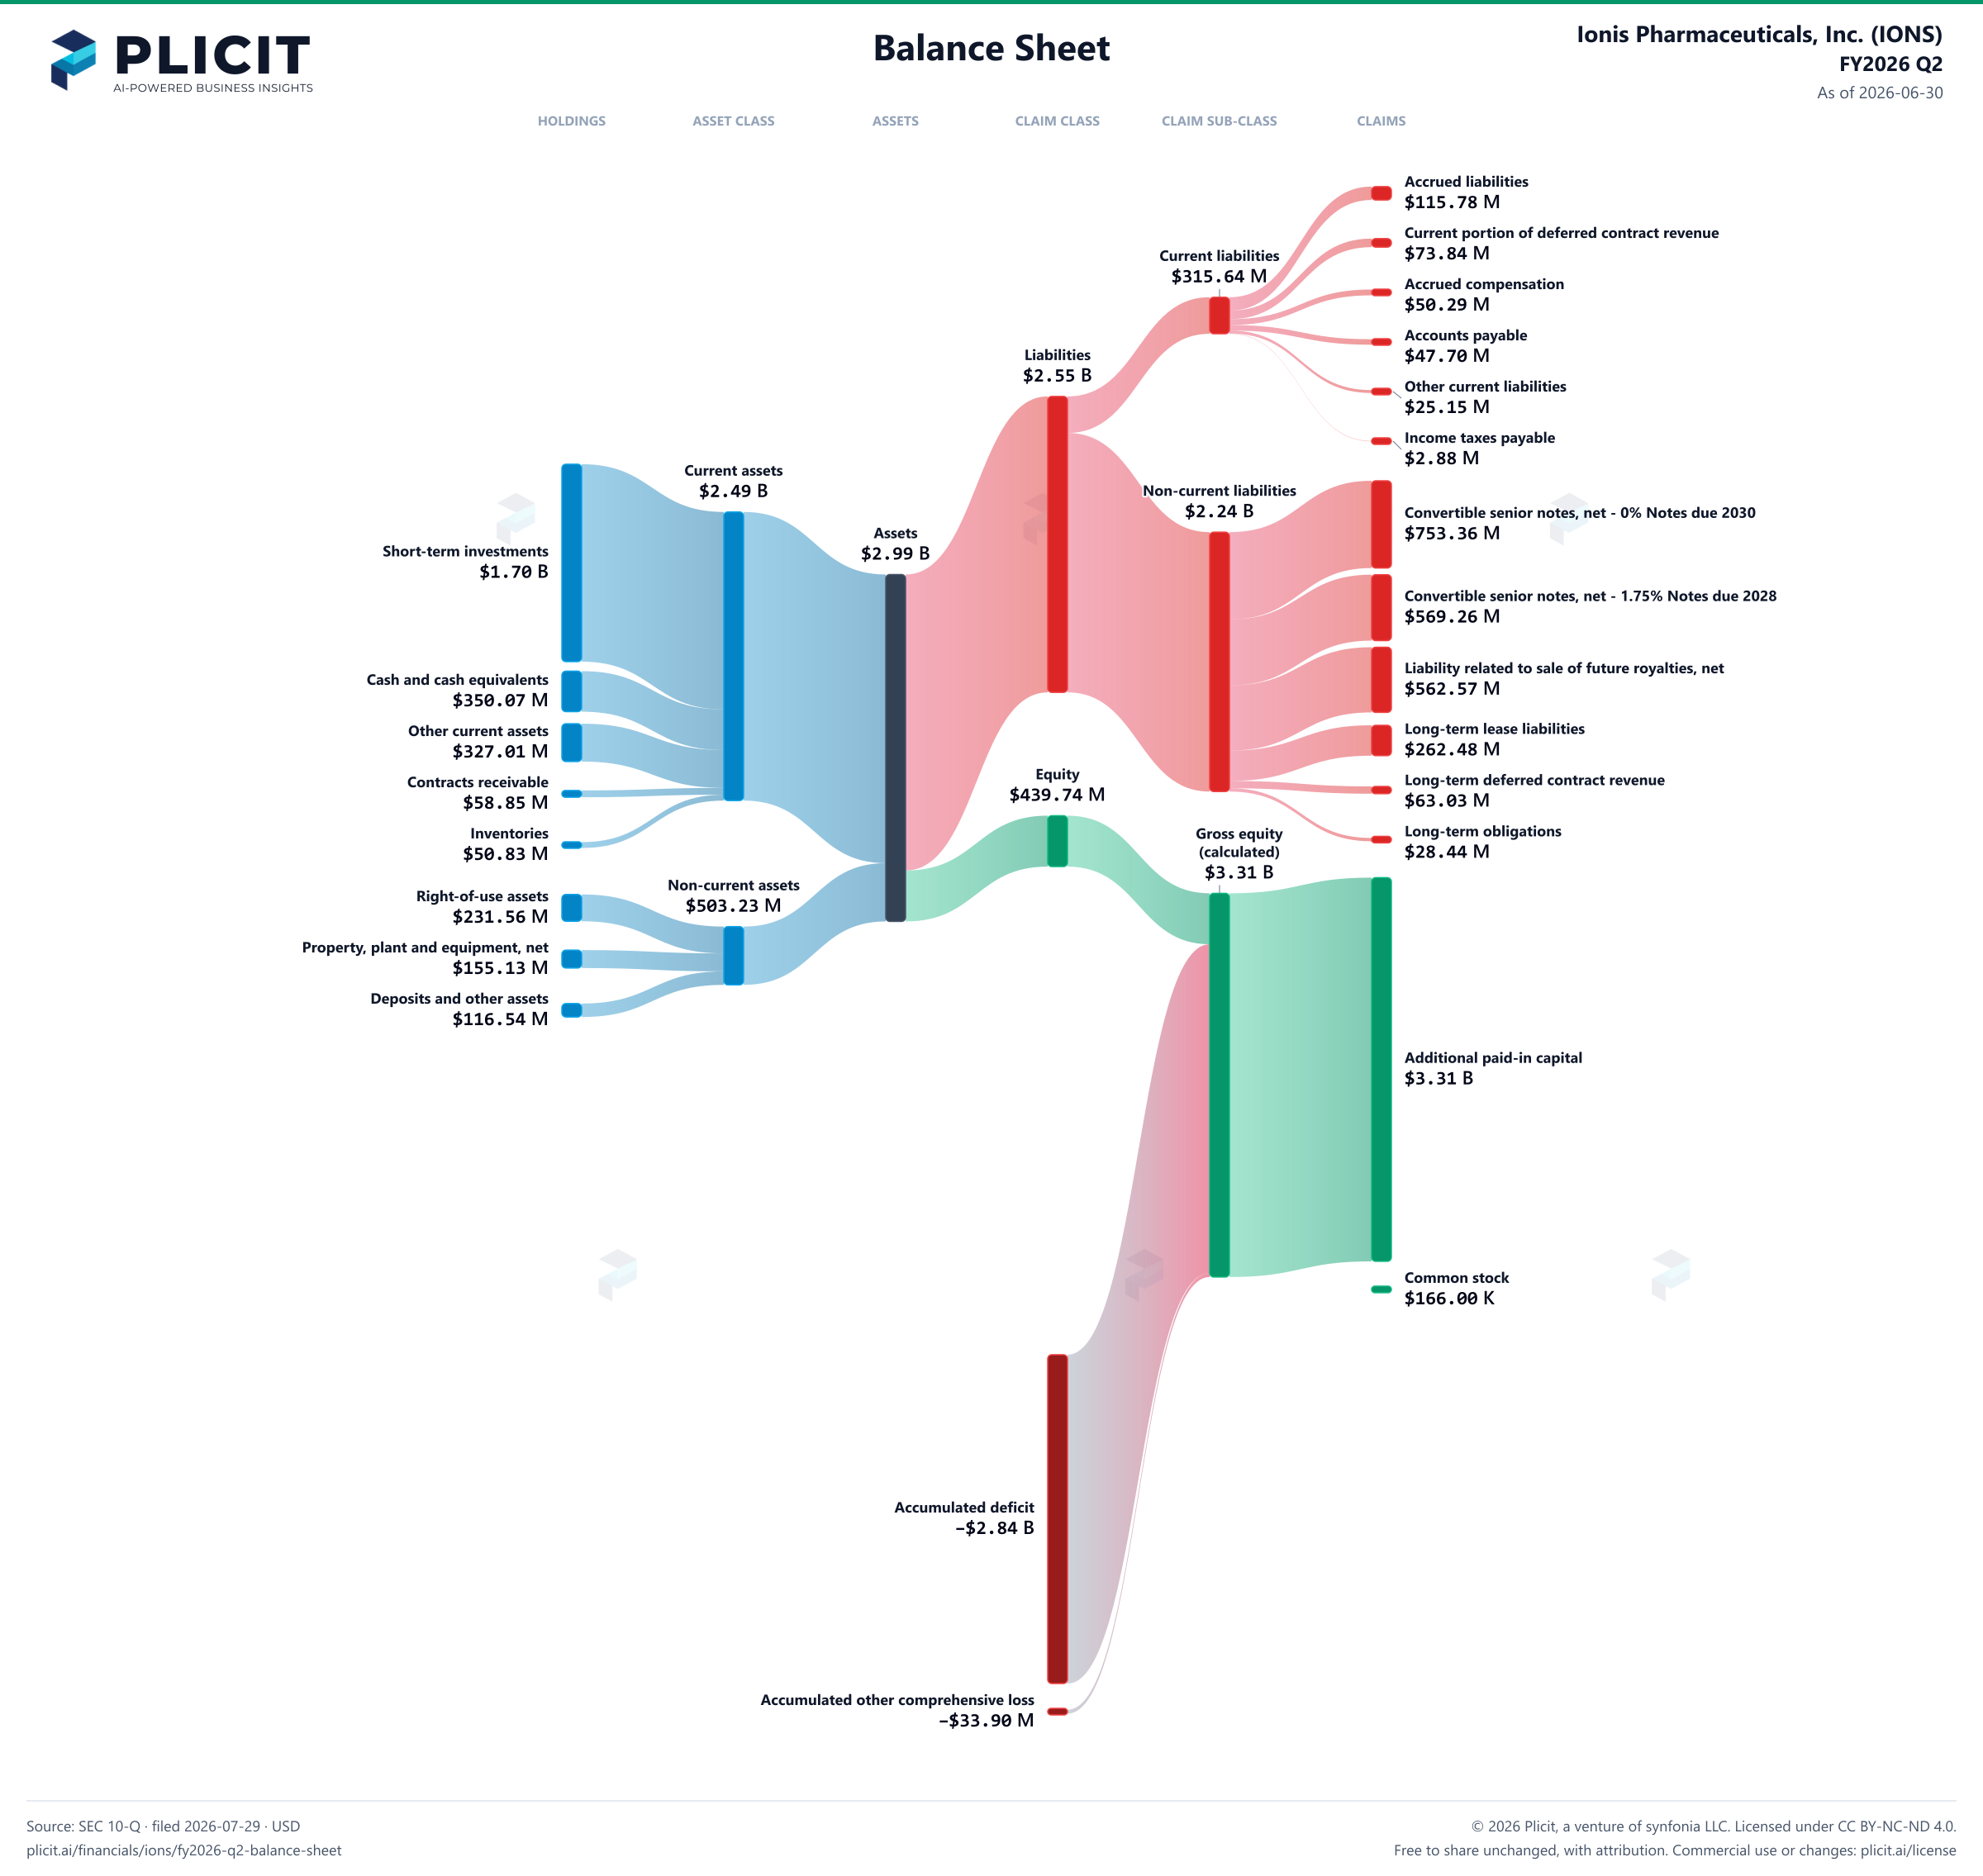
Balance sheet as of 2026-06-30. The chart shows assets, liabilities and equity at that date.
- Assets
- 2,994,501,000 US dollars
- Current assets
- 2,491,274,000 US dollars
- Non-current assets
- 503,227,000 US dollars
- Liabilities
- 2,554,764,000 US dollars
- Current liabilities
- 315,638,000 US dollars
- Non-current liabilities
- 2,239,126,000 US dollars
- Equity
- 439,737,000 US dollars
- Short-term investments
- 1,704,520,000 US dollars
- Cash and cash equivalents
- 350,065,000 US dollars
- Other current assets
- 327,011,000 US dollars
- Contracts receivable
- 58,845,000 US dollars
- Inventories
- 50,833,000 US dollars
- Right-of-use assets
- 231,560,000 US dollars
- Property, plant and equipment, net
- 155,131,000 US dollars
- Deposits and other assets
- 116,536,000 US dollars
- Accrued liabilities
- 115,778,000 US dollars
- Current portion of deferred contract revenue
- 73,837,000 US dollars
- Accrued compensation
- 50,293,000 US dollars
- Accounts payable
- 47,704,000 US dollars
- Other current liabilities
- 25,149,000 US dollars
- Income taxes payable
- 2,877,000 US dollars
- 0 percent convertible senior notes due April 2026, net
- 0 US dollars
- Convertible senior notes, net - 0% Notes due 2030
- 753,356,000 US dollars
- Convertible senior notes, net - 1.75% Notes due 2028
- 569,255,000 US dollars
- Liability related to sale of future royalties, net
- 562,574,000 US dollars
- Long-term lease liabilities
- 262,476,000 US dollars
- Long-term deferred contract revenue
- 63,030,000 US dollars
- Long-term obligations
- 28,435,000 US dollars
- Additional paid-in capital
- 3,311,837,000 US dollars
- Common stock, $0.001 par value; 300,000,000 shares authorized, 165,636,792 and 163,304,875 shares issued and outstanding at June 30, 2026 and December 31, 2025, respectively
- 166,000 US dollars
- Accumulated deficit
- negative 2,838,369,000 US dollars
- Accumulated other comprehensive loss
- negative 33,897,000 US dollars
- Gross equity (calculated)
- 3,312,003,000 US dollars. Net equity plus the magnitudes of its negative contributions equals gross positive equity. The negative contributions enter this reconciliation as add-backs; their filed signs stay negative.
Chart connections
- Assets equal liabilities plus consolidated equity. Consolidated equity includes noncontrolling interests when reported.
- Treasury shares and other negative equity contributions reduce equity.
Free to share unchanged, with credit to Plicit.ai · CC BY-NC-ND 4.0Download PNG
Product waitlist
Health Check and Teardown for your own company
A health check uncovers insights of your private books, not a public ticker. Join this list to get notified as soon as we go-live!