
Ionis Pharmaceuticals, Inc. (IONS) FY2026 Q2 P&L / Income Statement

Revenue by Product and Service by Arrangement

2026-04-01 to 2026-06-30

Swipe to see the full flow
Ionis Pharmaceuticals, Inc. (IONS) FY2026 Q2 P&L / Income StatementIncome statement for 2026-04-01 through 2026-06-30. View: Product and Service by Collaborative Arrangement and Arrangement Other than Collaborative. Revenue uses this breakdown; costs and expenses retain the consolidated categories.SOURCESREVENUEGROSSOPERATINGPRE-TAXNETCollaborative Agreement RevenueSalanersen - Biogen Collaboration2017 Spinal Muscular Atrophy MemberDAWNZERA Sales, NetSapablursen - OnoWAINUA Joint Development RevenueUndisclosed (calculated)TRYNGOLZA Sales, NetOther Commercial RevenueOther RoyaltiesRevenueGross profit (calculated)Cost of salesIncome (loss) from operationsOperating expenses (calculated)Research, development and patentSelling, general and administrativeIncome (loss) before income tax benefit (expense)Other income (expense), net (calculated)Net income (loss)Income tax benefit (expense)Income (loss) before income tax benefit (expense)Income (loss)before income taxbenefit (expense)−$113.38 MGross profit (calculated)Gross profit(calculated)$265.21 MIncome (loss) from operationsIncome (loss)from operations−$102.29 MRevenueRevenue$267.95 MNet income (loss)Net income (loss)−$114.65 MCollaborative Agreement RevenueCollaborative Agreement Revenue$133.14 MOperating expenses (calculated)Operating expenses(calculated)$367.50 MSalanersen - Biogen Collaboration2017 Spinal Muscular Atrophy MemberSalanersen - 2017 SMA$45.00 MIncome tax benefit (expense)Income tax benefit(expense)$1.26 MDAWNZERA Sales, NetDAWNZERA Sales, Net$26.57 MResearch, development and patentResearch, development and patent$217.11 MSapablursen - OnoSapablursen - Ono$20.00 MCost of salesCost of sales$2.74 MWAINUA Joint Development RevenueWAINUA Joint Development Revenue$16.19 MUndisclosed (calculated)Undisclosed (calculated)$4.92 MSelling, general and administrativeSelling, general and administrative$150.40 MTRYNGOLZA Sales, NetTRYNGOLZA Sales, Net$4.57 MOther Commercial RevenueOther Commercial Revenue$11.53 MOther RoyaltiesOther Royalties$6.04 MOther income (expense), net (calculated)Other income,net (calculated)−$11.09 M
Chart details

Ionis Pharmaceuticals, Inc. (IONS) FY2026 Q2 P&L / Income Statement

Income statement for 2026-04-01 through 2026-06-30. View: Product and Service by Collaborative Arrangement and Arrangement Other than Collaborative. Revenue uses this breakdown; costs and expenses retain the consolidated categories.

Revenue
267,949,000 US dollars
Cost of sales
2,739,000 US dollars
Gross profit (calculated)
265,210,000 US dollars
Operating expenses (calculated)
367,503,000 US dollars
Income (loss) from operations
negative 102,293,000 US dollars
Other income (expense), net (calculated)
negative 11,089,000 US dollars
Income (loss) before income tax benefit (expense)
negative 113,382,000 US dollars
Income tax benefit (expense)
1,264,000 US dollars
Net income (loss)
negative 114,646,000 US dollars
Collaborative Agreement Revenue
133,137,000 US dollars
DAWNZERA Sales, Net
26,565,000 US dollars
Other Commercial Revenue
11,526,000 US dollars
Other Royalties
6,036,000 US dollars
TRYNGOLZA Sales, Net
4,574,000 US dollars
WAINUA Joint Development Revenue
16,189,000 US dollars
Salanersen - Biogen Collaboration2017 Spinal Muscular Atrophy Member
45,000,000 US dollars
Sapablursen - Ono
20,000,000 US dollars
Undisclosed (calculated)
4,922,000 US dollars
Research, development and patent
217,107,000 US dollars
Selling, general and administrative
150,396,000 US dollars

Chart connections

  • Revenue less cost of revenue equals gross profit; gross profit less operating expenses equals operating income.
  • Operating income plus other income or expense equals income before tax. Income before tax less income tax expense or benefit equals net income.
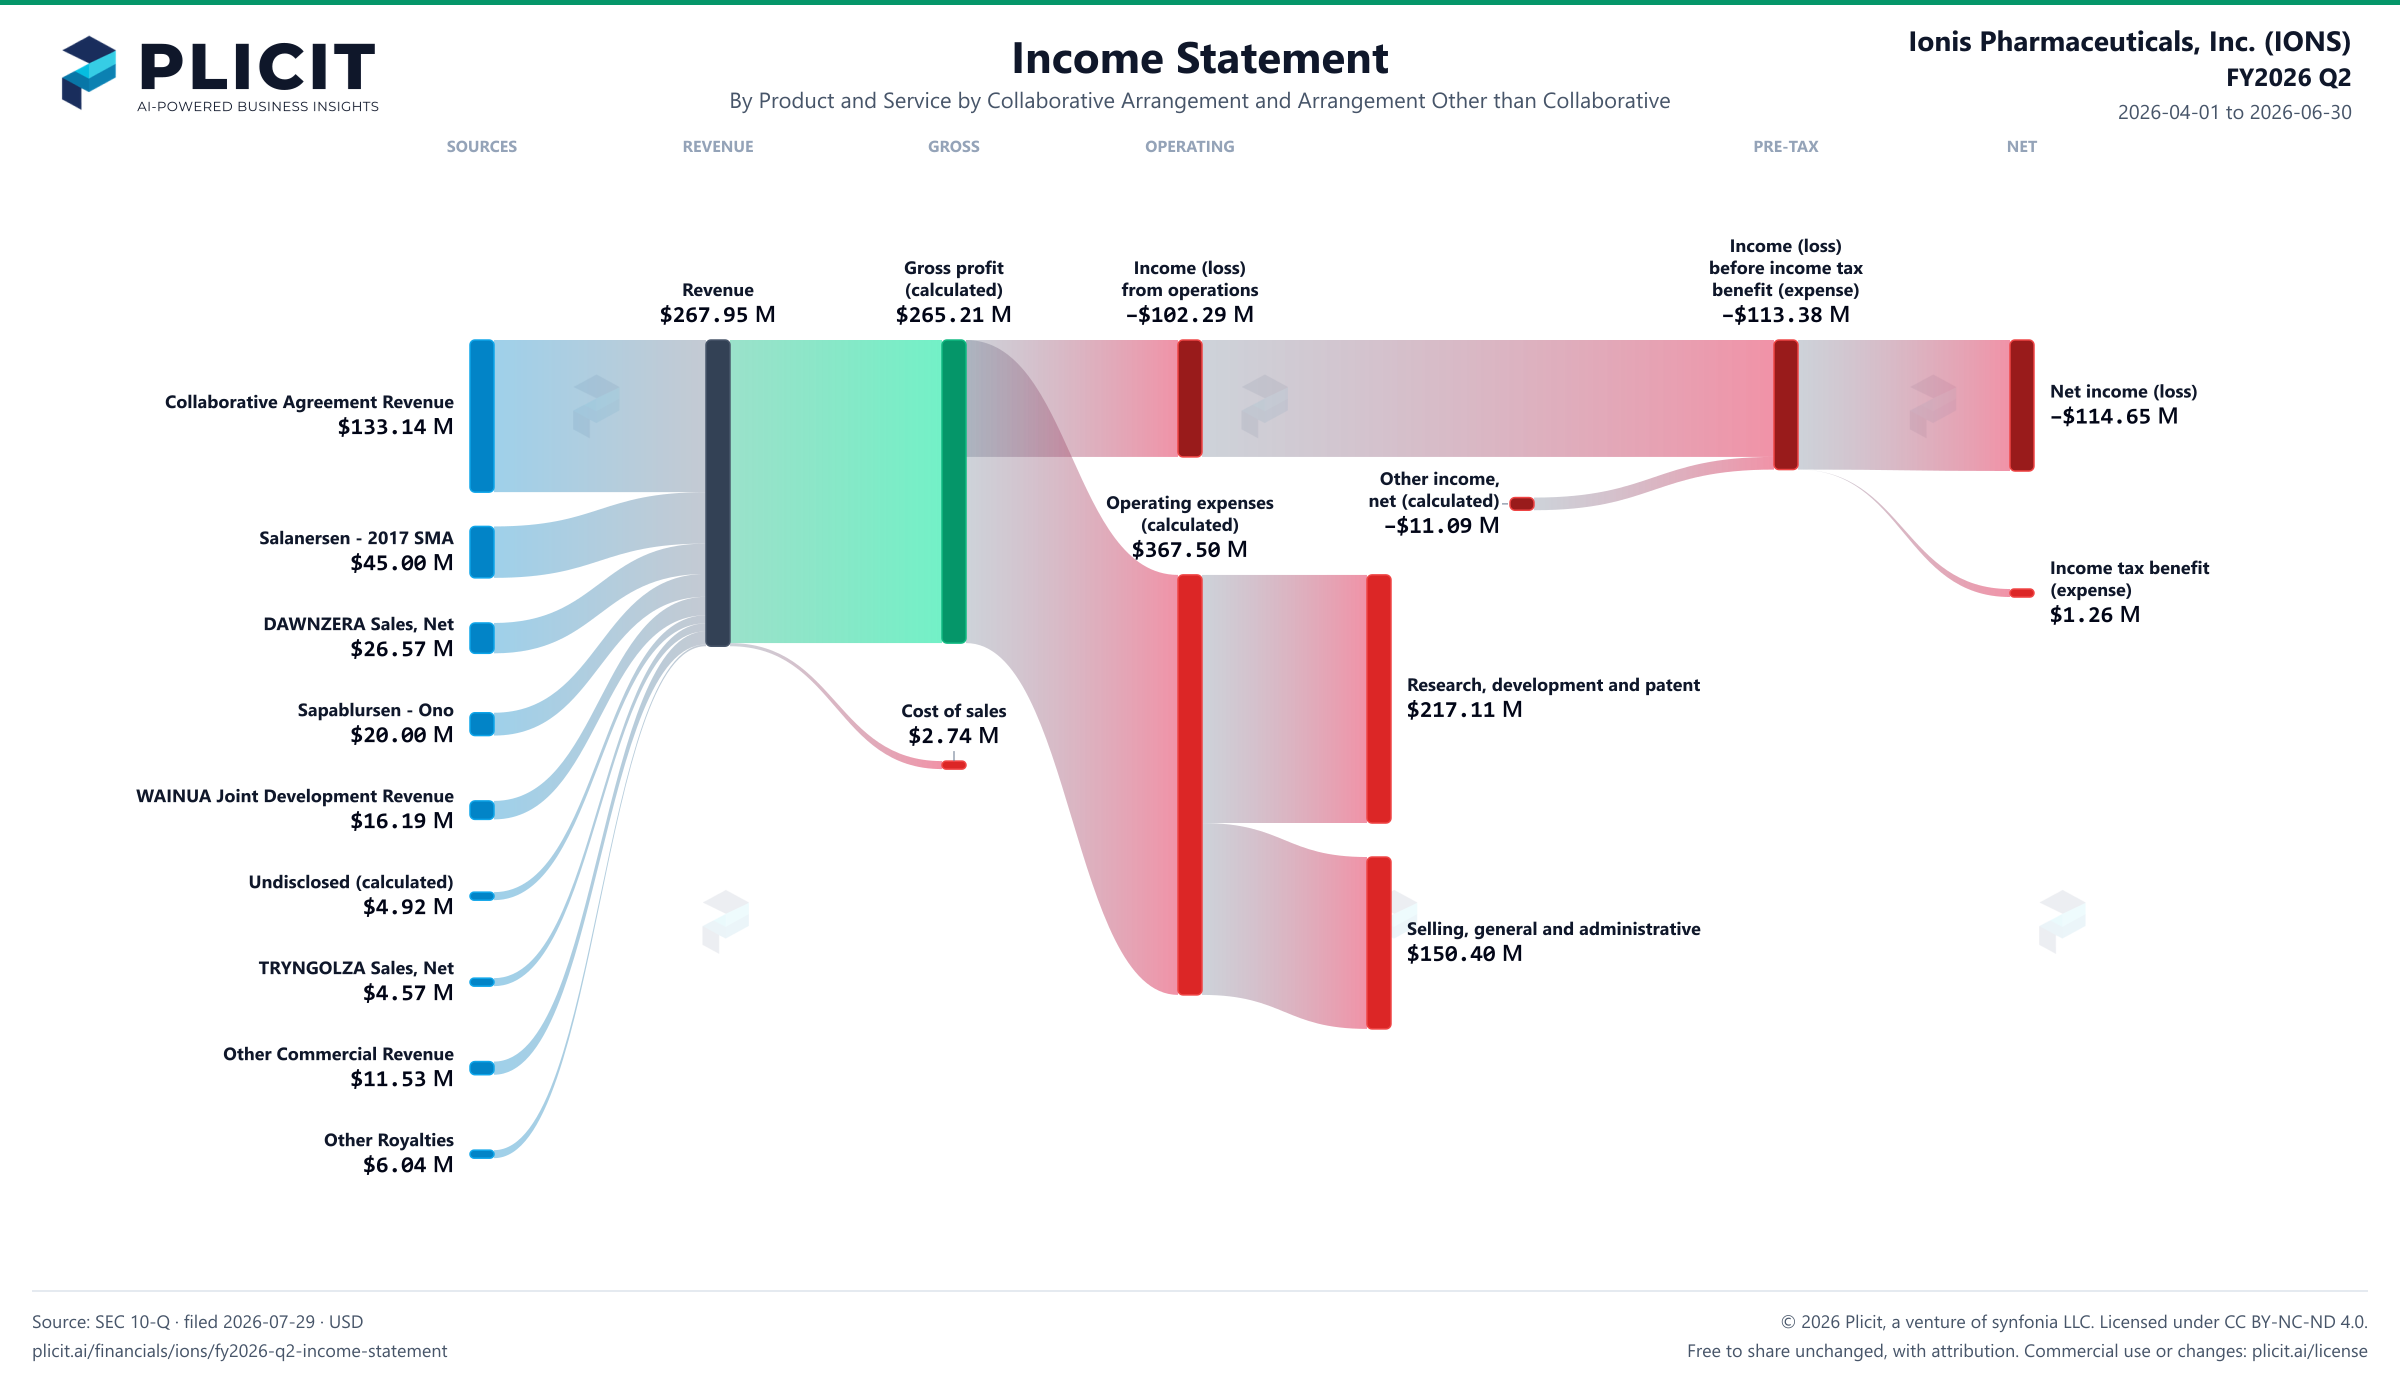
Ionis Pharmaceuticals, Inc. (IONS) FY2026 Q2 P&L / Income Statement Sankey chart, Product and service — Product and Service by Collaborative Arrangement and Arrangement Other than Collaborative view
Free to share unchanged, with credit to Plicit.ai · CC BY-NC-ND 4.0Download PNG

Gross margin

99.0%

Gross profit / revenue

Operating margin

−38.2%

Operating profit / revenue

Newsletter

Get the teardowns by email

Subscribe if you want the public-company teardowns in your inbox when they're released.

Product waitlist

Health Check and Teardown for your own company

A health check uncovers insights of your private books, not a public ticker. Join this list to get notified as soon as we go-live!