
Gartner, Inc. (IT) FY2026 Q2 Balance Sheet

Balance Sheet

As of 2026-06-30

Swipe to see the full flow
Gartner, Inc. (IT) FY2026 Q2 Balance SheetBalance sheet as of 2026-06-30. The chart shows assets, liabilities and equity at that date.Current liabilities$3.66 BLiabilities$7.36 BNon-current liabilities$3.70 BCurrent assets$3.22 BAssets$7.19 BNon-current assets$3.97 BEquity−$167.35 MHOLDINGSASSET CLASSASSETSCLAIM CLASSCLAIM SUB-CLASSCLAIMSCash and cash equivalentsFees receivable, net of allowances of $4,500 and $5,000, respectivelyDeferred commissionsPrepaid expenses and other current assetsGoodwillOther assetsIntangible assets, netOperating lease right-of-use assetsProperty, equipment and leasehold improvements, netDeferred revenuesAccounts payable and accrued liabilitiesLong-term debt, net of deferred financing feesOther liabilitiesOperating lease liabilitiesAccumulated earningsAdditional paid-in capitalCommon stock, $0.0005 par value, 250,000,000 shares authorized; 163,602,067 shares issued for both periodsTreasury stock, at cost, 99,197,399 and 92,752,769 common shares, respectivelyAccumulated other comprehensive loss, netCurrent assetsNon-current assetsAssetsCurrent liabilitiesNon-current liabilitiesLiabilitiesEquityCurrent liabilitiesCurrent liabilities$3.66 BLiabilitiesLiabilities$7.36 BDeferred revenuesDeferred revenues$2.76 BAccounts payable and accrued liabilitiesAccounts payable and accrued liabilities$907.10 MNon-current liabilitiesNon-current liabilities$3.70 BLong-term debt, net of deferred financing feesLong-term debt, net of deferred financing fees$2.98 BOther liabilitiesOther liabilities$465.01 MOperating lease liabilitiesOperating lease liabilities$253.43 MCurrent assetsCurrent assets$3.22 BCash and cash equivalentsCash and cash equivalents$1.49 BFees receivable, net of allowances of $4,500 and $5,000, respectivelyFees receivable, net$1.20 BAssetsAssets$7.19 BDeferred commissionsDeferred commissions$352.18 MAccumulated earningsAccumulated earnings$7.22 BPrepaid expenses and other current assetsPrepaid expenses and other current assets$181.23 MNon-current assetsNon-current assets$3.97 BGoodwillGoodwill$2.74 BAdditional paid-in capitalAdditional paid-in capital$2.77 BOther assetsOther assets$528.66 MIntangible assets, netIntangible assets, net$294.43 MEquityEquity−$167.35 MCommon stock, $0.0005 par value, 250,000,000 shares authorized; 163,602,067 shares issued for both periodsCommon stock$82.00 KOperating lease right-of-use assetsOperating lease right-of-use assets$208.38 MProperty, equipment and leasehold improvements, netProperty, equipment and leasehold improvements, net$199.25 MTreasury stock, at cost, 99,197,399 and 92,752,769 common shares, respectivelyTreasury stock−$10.11 BAccumulated other comprehensive loss, netAccumulated other comprehensive loss, net−$52.42 M
Chart details

Gartner, Inc. (IT) FY2026 Q2 Balance Sheet

Balance sheet as of 2026-06-30. The chart shows assets, liabilities and equity at that date.

Assets
7,193,674,000 US dollars
Current assets
3,224,328,000 US dollars
Non-current assets
3,969,346,000 US dollars
Liabilities
7,361,019,000 US dollars
Current liabilities
3,663,304,000 US dollars
Non-current liabilities
3,697,715,000 US dollars
Equity
negative 167,345,000 US dollars
Cash and cash equivalents
1,488,706,000 US dollars
Fees receivable, net of allowances of $4,500 and $5,000, respectively
1,202,212,000 US dollars
Deferred commissions
352,184,000 US dollars
Prepaid expenses and other current assets
181,226,000 US dollars
Assets held-for-sale
0 US dollars
Goodwill
2,738,631,000 US dollars
Other assets
528,656,000 US dollars
Intangible assets, net
294,434,000 US dollars
Operating lease right-of-use assets
208,375,000 US dollars
Property, equipment and leasehold improvements, net
199,250,000 US dollars
Deferred revenues
2,756,202,000 US dollars
Accounts payable and accrued liabilities
907,102,000 US dollars
Current portion of long-term debt
0 US dollars
Liabilities held-for-sale
0 US dollars
Long-term debt, net of deferred financing fees
2,979,281,000 US dollars
Other liabilities
465,008,000 US dollars
Operating lease liabilities
253,426,000 US dollars
Accumulated earnings
7,220,080,000 US dollars
Additional paid-in capital
2,774,555,000 US dollars
Common stock, $0.0005 par value, 250,000,000 shares authorized; 163,602,067 shares issued for both periods
82,000 US dollars
Preferred stock, $0.01 par value, 5,000,000 shares authorized; none issued or outstanding
0 US dollars
Treasury stock, at cost, 99,197,399 and 92,752,769 common shares, respectively
negative 10,109,643,000 US dollars
Accumulated other comprehensive loss, net
negative 52,419,000 US dollars

Chart connections

  • Assets equal liabilities plus consolidated equity. Consolidated equity includes noncontrolling interests when reported.
  • Treasury shares and other negative equity contributions reduce equity.
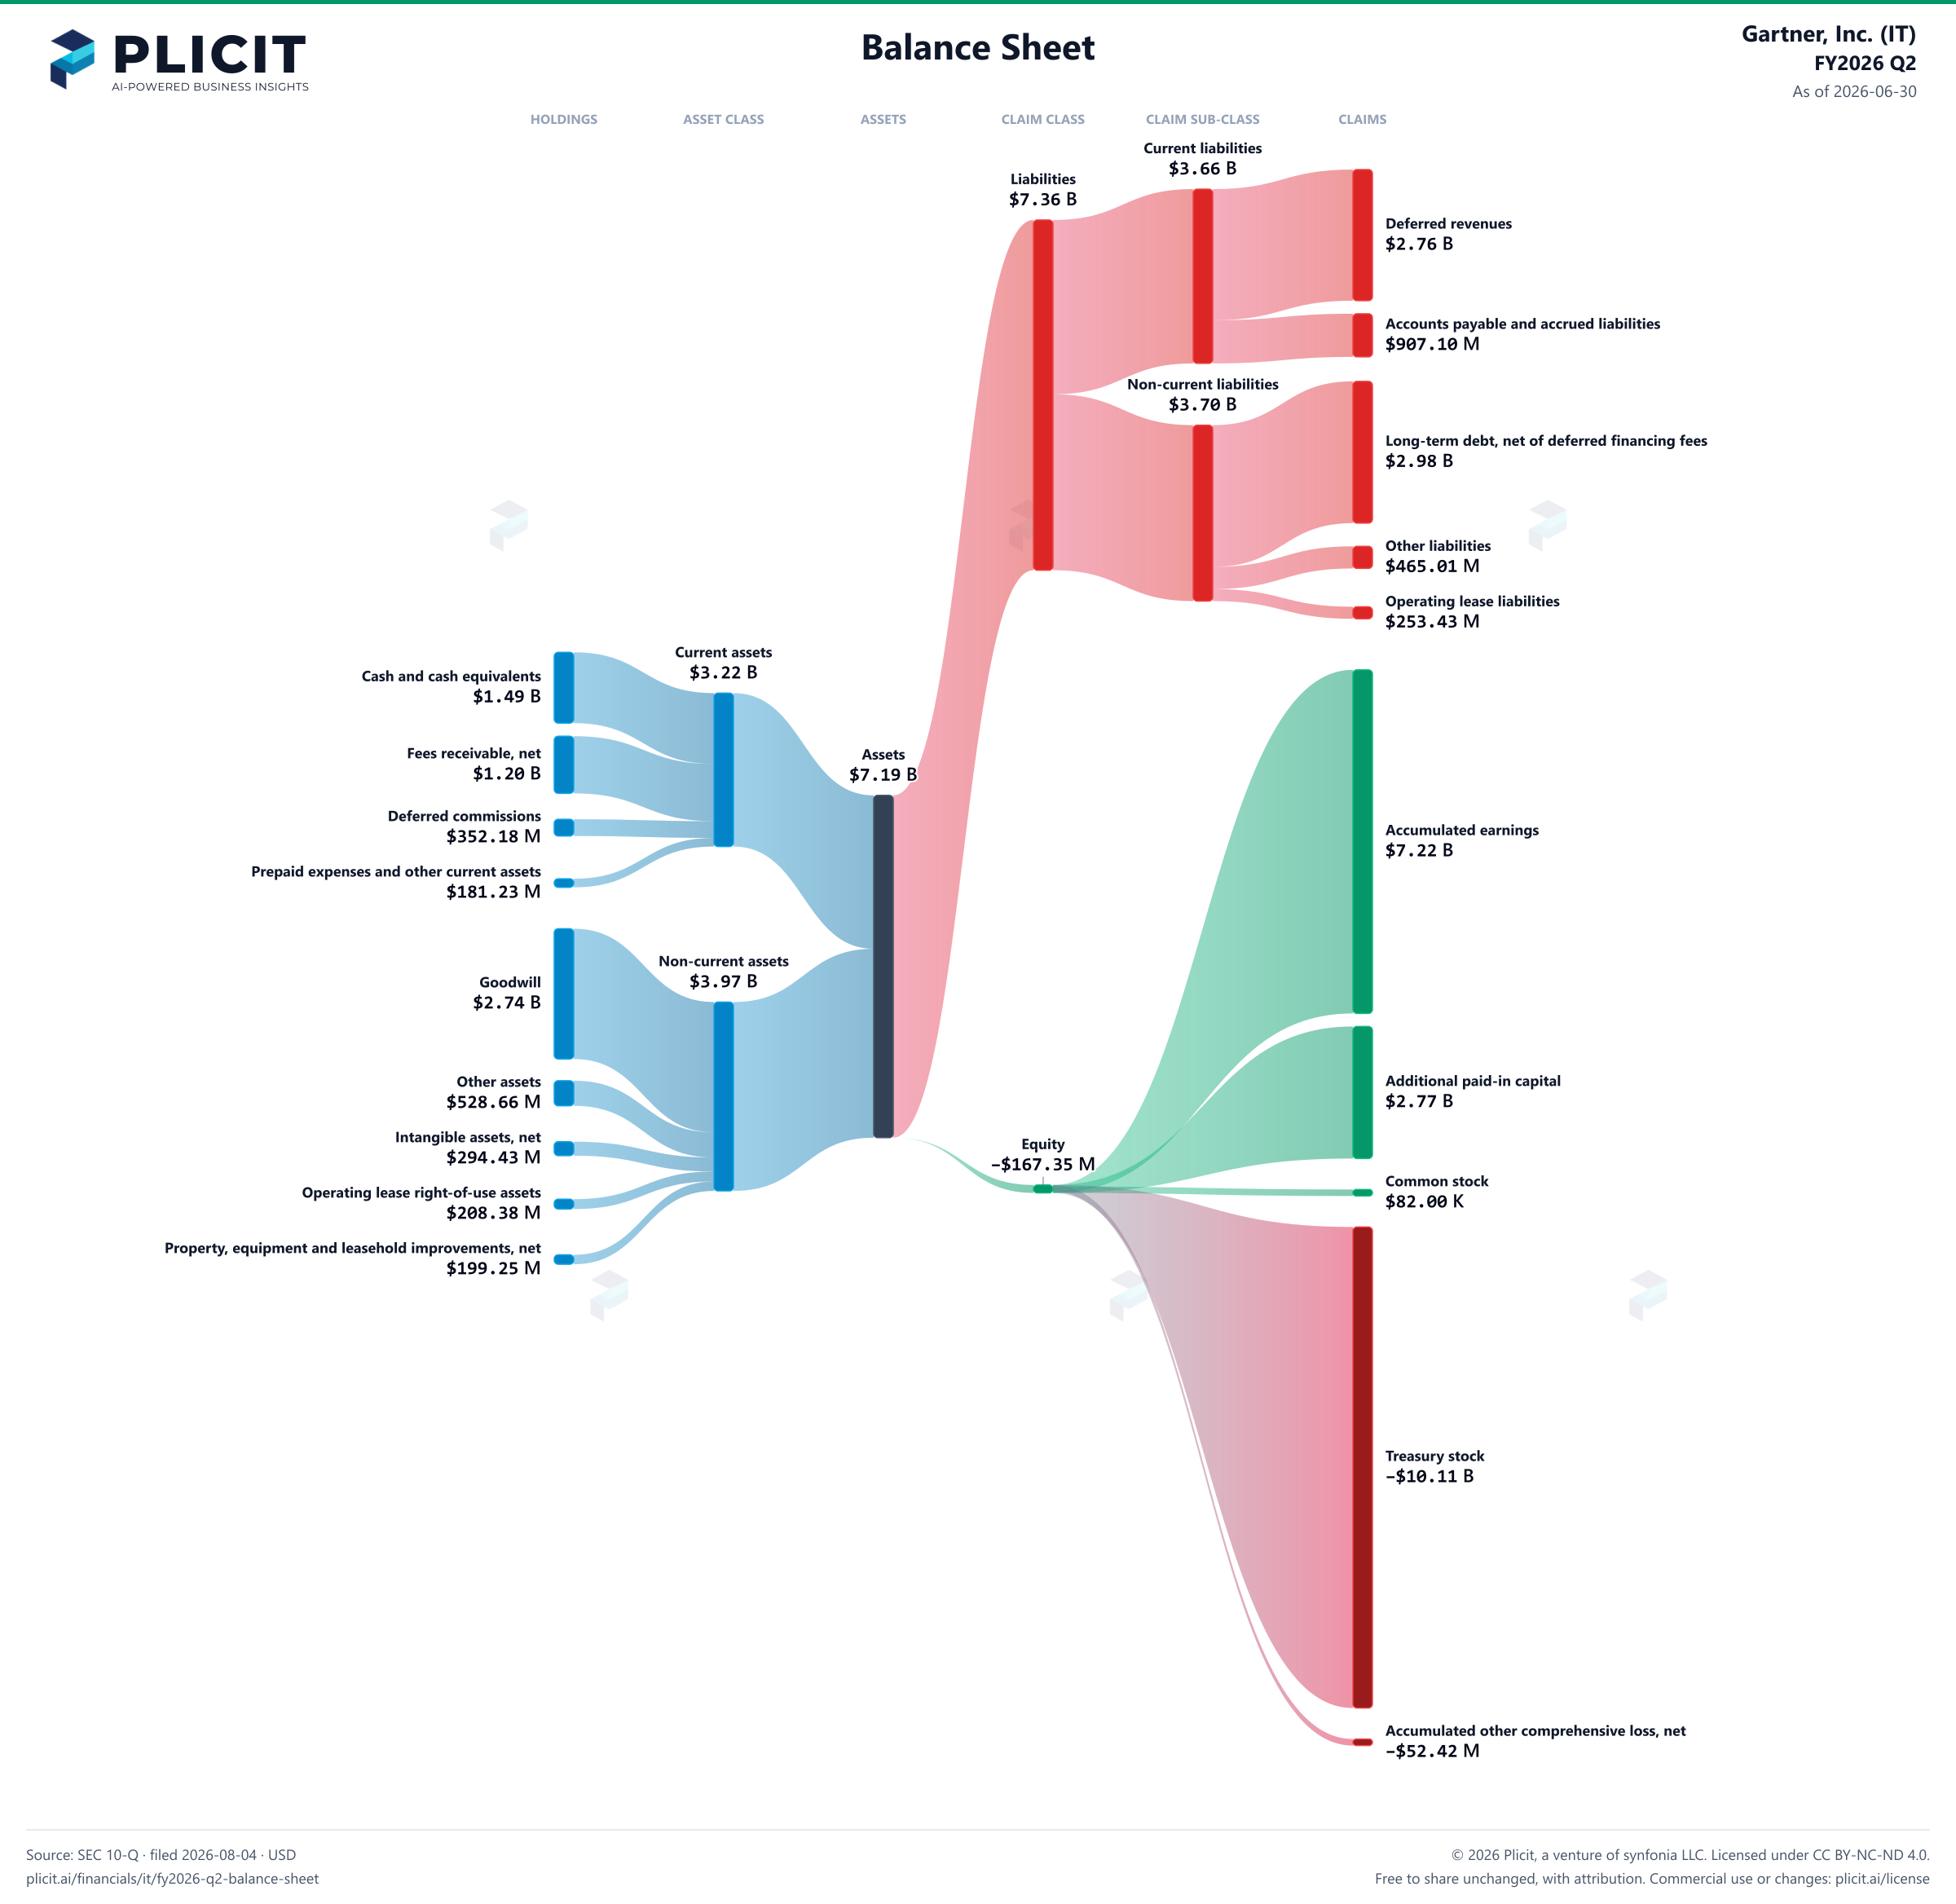
Gartner, Inc. (IT) FY2026 Q2 Balance Sheet Sankey chart
Free to share unchanged, with credit to Plicit.ai · CC BY-NC-ND 4.0Download PNG

Newsletter

Get the teardowns by email

Subscribe if you want the public-company teardowns in your inbox when they're released.

Product waitlist

Health Check and Teardown for your own company

A health check uncovers insights of your private books, not a public ticker. Join this list to get notified as soon as we go-live!