
Gartner, Inc. (IT) FY2026 YTD Q2 P&L / Income Statement

2026-01-01 to 2026-06-30

Swipe to see the full flow
Gartner, Inc. (IT) FY2026 YTD Q2 P&L / Income StatementIncome statement for 2026-01-01 through 2026-06-30. View: Segments by Geographical. Revenue uses this breakdown; costs and expenses retain the consolidated categories.SOURCESREVENUEGROSSOPERATINGPRE-TAXNETInsights - United States and CanadaInsights - Europe, Middle East and AfricaInsights - Other InternationalConferences - United States and CanadaConsulting - United States and CanadaConferences - Europe, Middle East and AfricaConsulting - Europe, Middle East and AfricaConferences - Other InternationalConsulting - Other InternationalOther - United States and CanadaOther - Europe, Middle East and AfricaOther - Other InternationalTotal revenuesGross profit (calculated)Cost of services and product developmentOperating incomeOperating expenses (calculated)Selling, general and administrativeDepreciationAmortization of intangiblesGain from sale of divested operationIncome before income taxesOther income (expense), net (calculated)Net incomeProvision for income taxesGross profit (calculated)Gross profit(calculated)$2.27 BTotal revenuesTotal revenues$3.19 BOperating incomeOperating income$694.61 MIncome before income taxesPretax income$647.04 MNet incomeNet income$497.84 MInsights - United States and CanadaInsights - United States and Canada$1.54 BOperating expenses (calculated)Operating expenses(calculated)$1.58 BProvision for income taxesProvision forincome taxes$149.19 MOther income (expense), net (calculated)Other income,net (calculated)−$47.58 MInsights - Europe, Middle East and AfricaInsights - Europe,Middle East and Africa$712.18 MSelling, general and administrativeSelling, general and administrative$1.49 BCost of services and product developmentCost of services andproduct development$916.22 MInsights - Other InternationalInsights - Other International$330.99 MDepreciationDepreciation$50.51 MConferences - United States and CanadaConferences - UnitedStates and Canada$219.56 MAmortization of intangiblesAmortization of intangibles$40.10 MConsulting - United States and CanadaConsulting - UnitedStates and Canada$173.55 MGain from sale of divested operationGain from sale ofdivested operation−$5.40 MConferences - Europe, Middle East and AfricaConferences - Europe,Middle East and Africa$76.24 MConsulting - Europe, Middle East and AfricaConsulting - Europe,Middle East and Africa$66.53 MConferences - Other InternationalConferences - Other International$26.69 MConsulting - Other InternationalConsulting - Other International$20.97 MOther - United States and CanadaOther - United States and Canada$14.55 MOther - Europe, Middle East and AfricaOther - Europe, MiddleEast and Africa$3.36 MOther - Other InternationalOther - Other International$1.48 M
Chart details

Gartner, Inc. (IT) FY2026 YTD Q2 P&L / Income Statement

Income statement for 2026-01-01 through 2026-06-30. View: Segments by Geographical. Revenue uses this breakdown; costs and expenses retain the consolidated categories.

Total revenues
3,186,984,000 US dollars
Cost of services and product development
916,216,000 US dollars
Gross profit (calculated)
2,270,768,000 US dollars
Operating expenses (calculated)
1,576,156,000 US dollars
Operating income
694,612,000 US dollars
Other income (expense), net (calculated)
negative 47,577,000 US dollars
Income before income taxes
647,035,000 US dollars
Provision for income taxes
149,193,000 US dollars
Net income
497,842,000 US dollars
Conferences - Europe, Middle East and Africa
76,237,000 US dollars
Conferences - Other International
26,686,000 US dollars
Conferences - United States and Canada
219,559,000 US dollars
Consulting - Europe, Middle East and Africa
66,527,000 US dollars
Consulting - Other International
20,967,000 US dollars
Consulting - United States and Canada
173,551,000 US dollars
Insights - Europe, Middle East and Africa
712,178,000 US dollars
Insights - Other International
330,994,000 US dollars
Insights - United States and Canada
1,540,893,000 US dollars
Other - Europe, Middle East and Africa
3,358,000 US dollars
Other - Other International
1,481,000 US dollars
Other - United States and Canada
14,553,000 US dollars
Amortization of intangibles
40,104,000 US dollars
Depreciation
50,510,000 US dollars
Selling, general and administrative
1,490,941,000 US dollars
Gain from sale of divested operation
negative 5,399,000 US dollars

Chart connections

  • Revenue less cost of revenue equals gross profit; gross profit less operating expenses equals operating income.
  • Operating income plus other income or expense equals income before tax. Income before tax less income tax expense or benefit equals net income.
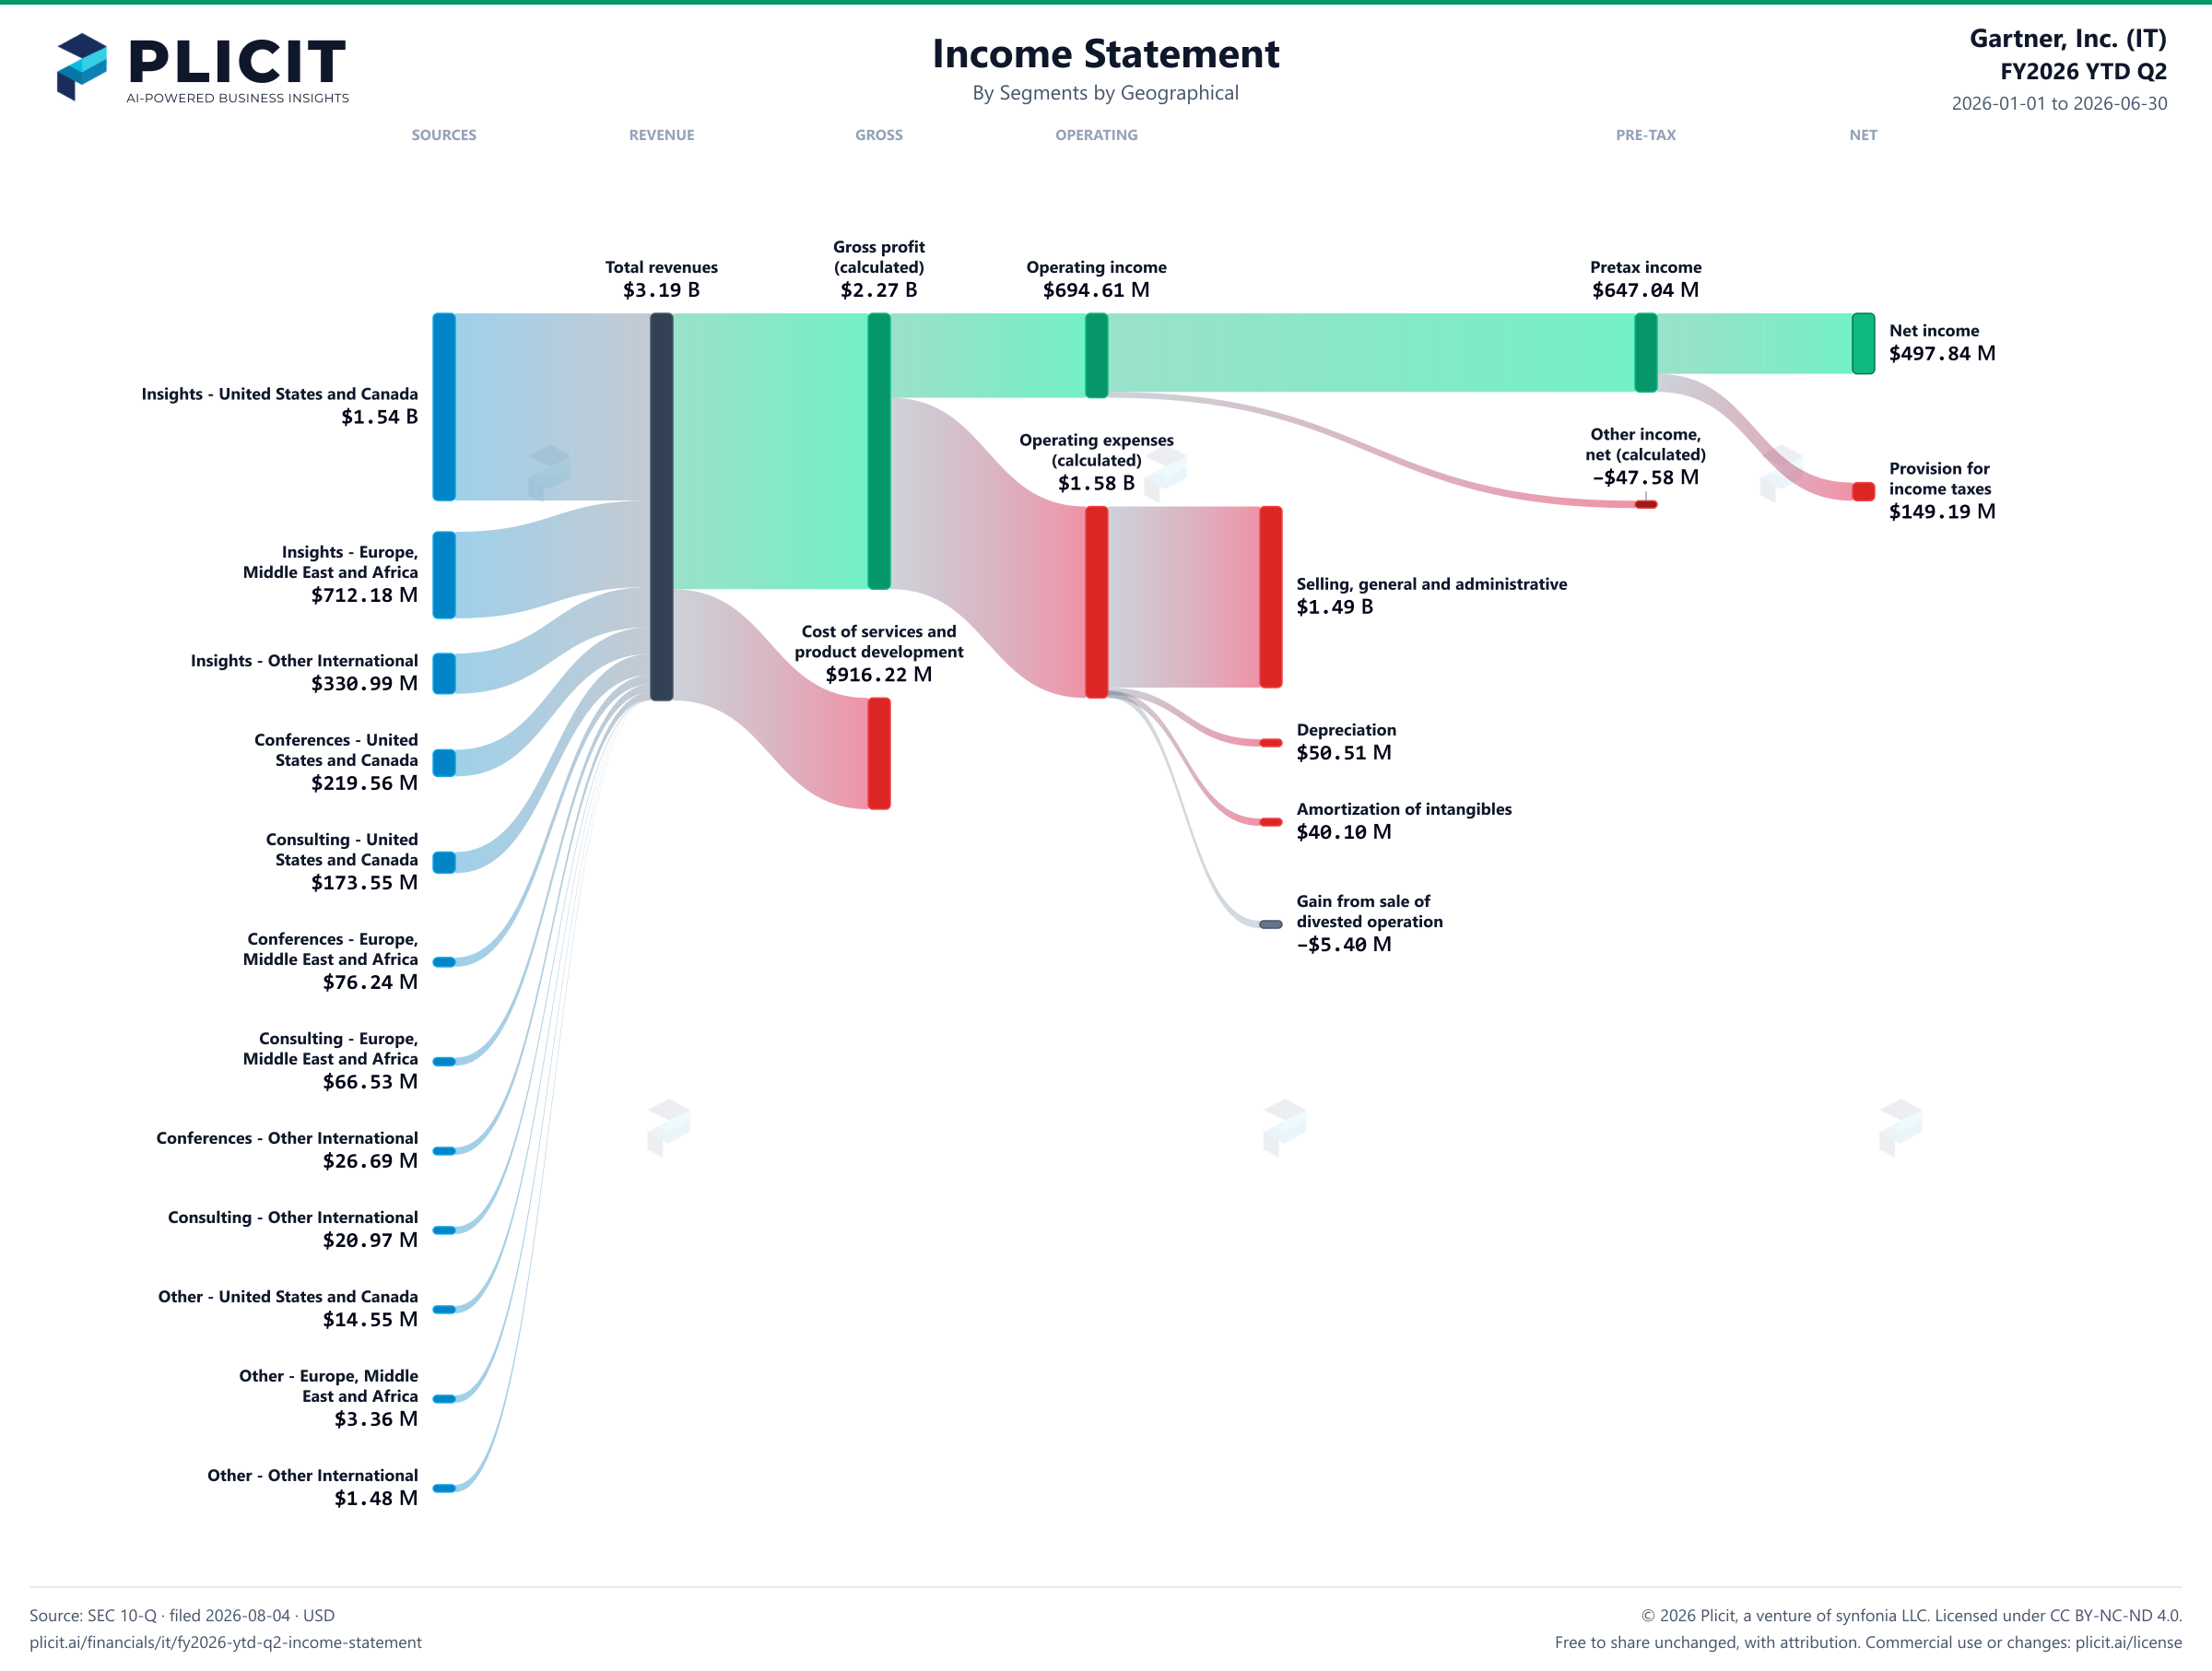
Gartner, Inc. (IT) FY2026 YTD Q2 Revenue by Business Segment by Geography Sankey chart
Free to share unchanged, with credit to Plicit.ai · CC BY-NC-ND 4.0Download PNG

Gross margin

71.3%

Gross profit / revenue

Operating margin

21.8%

Operating profit / revenue

Cash conversion

158.5%

Operating cash / net income, same period

Newsletter

Get the teardowns by email

Subscribe if you want the public-company teardowns in your inbox when they're released.

Product waitlist

Health Check and Teardown for your own company

A health check uncovers insights of your private books, not a public ticker. Join this list to get notified as soon as we go-live!