
ITT INC. (ITT) FY2026 Q2 P&L / Income Statement

Published · Updated Source: Form 10-Q on SEC EDGAR filed (opens in a new tab)

Key Takeaways

  • Interest expense rose to $49.70 M from $12.60 M and took 28% of operating profit.
  • The tax rate climbed to 36.0% from 25.9%, so less of the pre-tax profit was kept.
  • ITT booked $2.30 M of restructuring charges this quarter, a cost disclosed in Note 5.
  • Gross margin slipped to 34.6% from 36.1%, while R&D spending fell to 2.4% of sales from 2.8%.

The Unvarnished Truth

Operating profit rose 3%, yet net income fell 29%

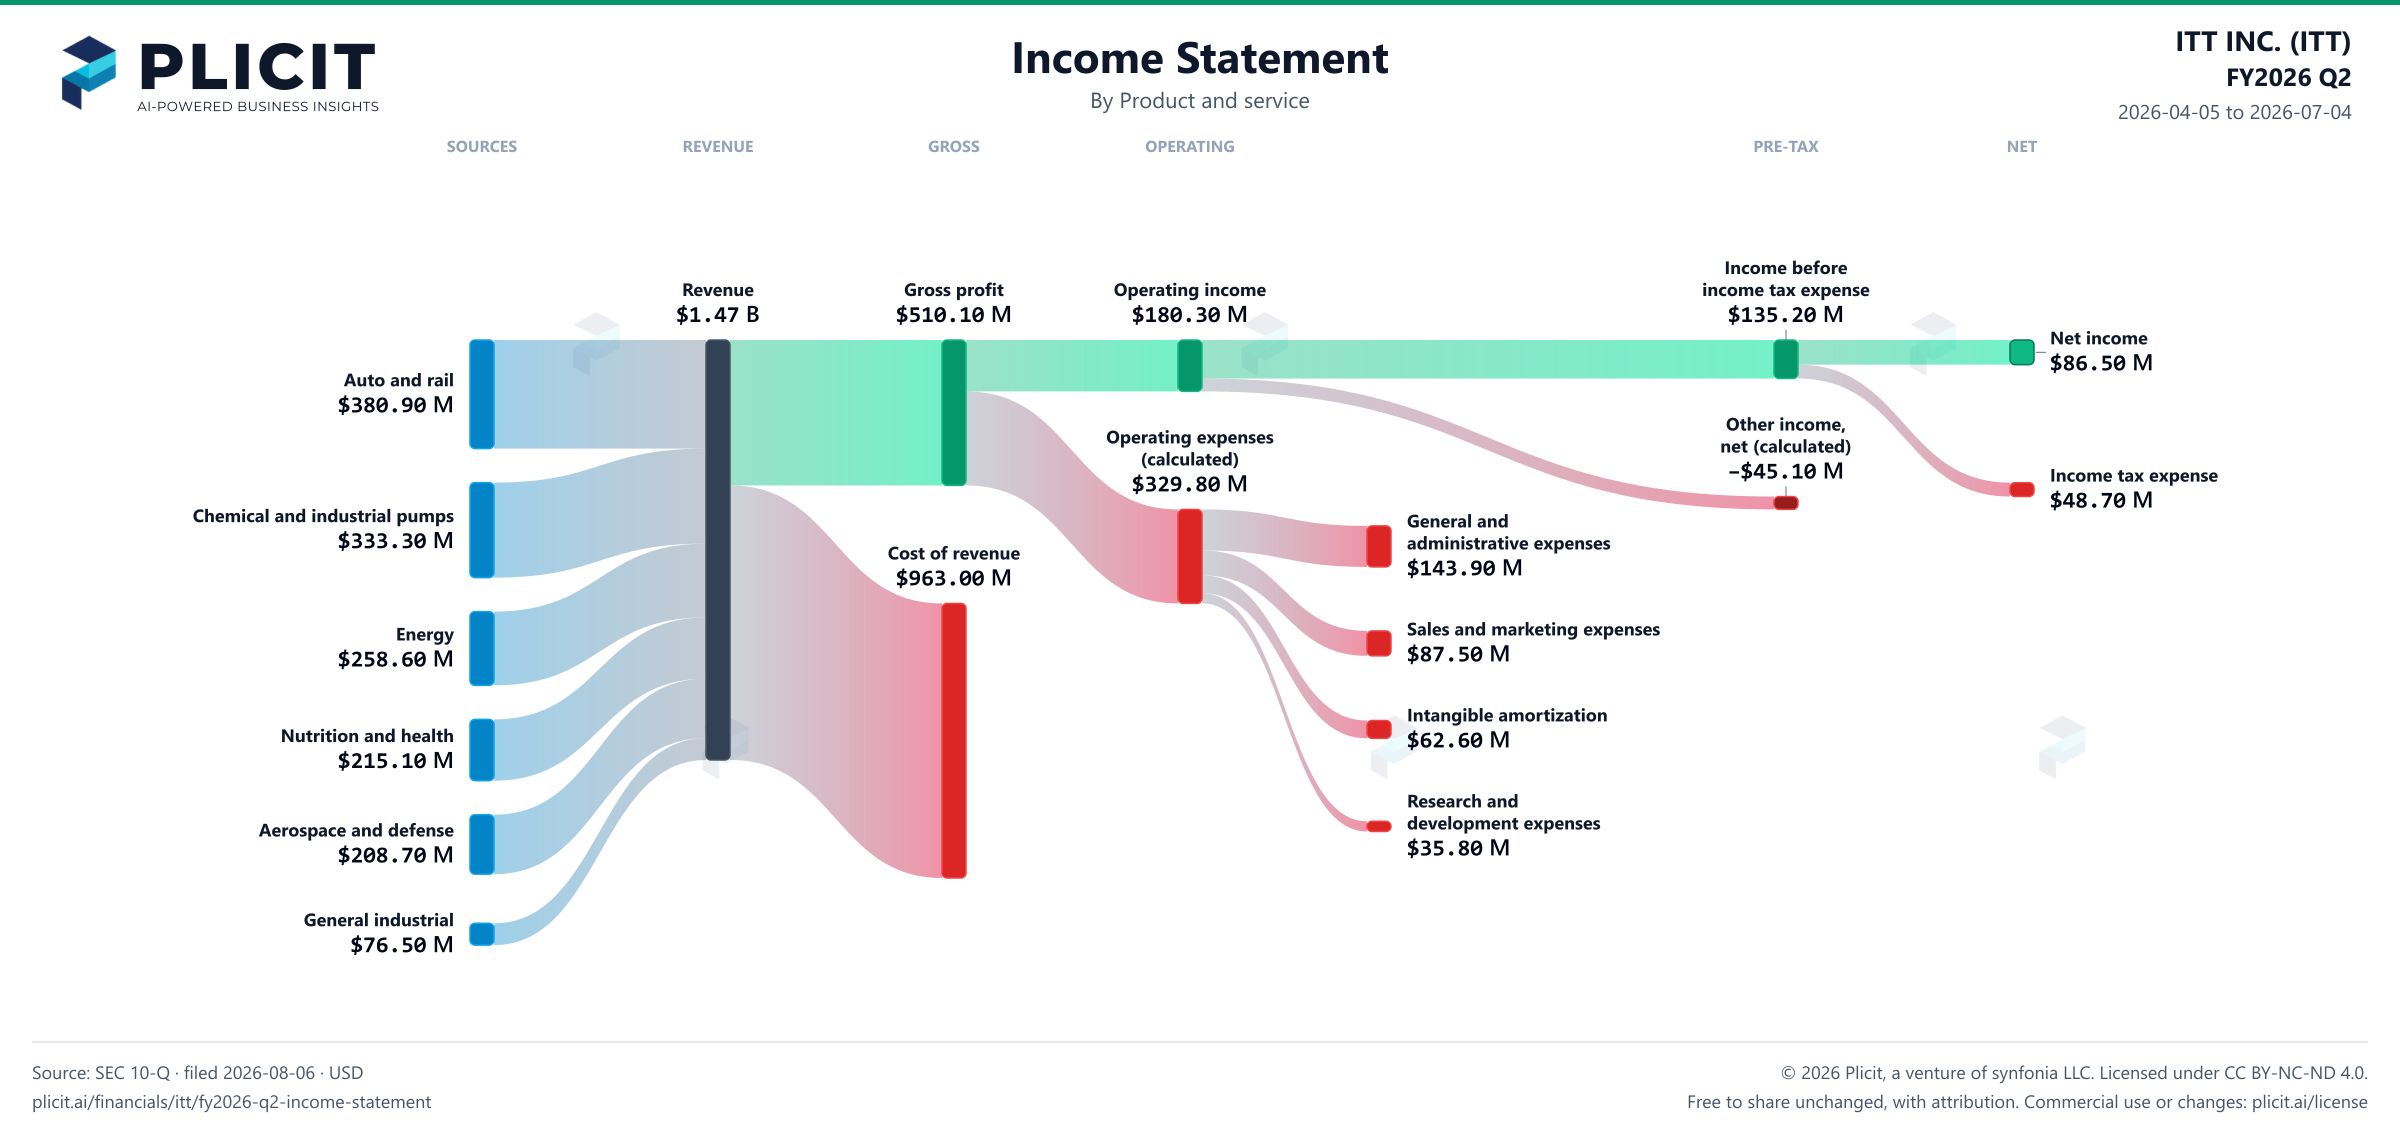
Operating profit rose 3% this quarter, to $180.30 M, yet net income fell 29%, to $86.50 M. The gap sits below the operating line, where interest and tax took the difference. Interest expense climbed to $49.70 M from $12.60 M, a jump the company ties to borrowing for the SPX FLOW deal. The company says its tax rate rose to 36.0% because of the acquisition, through extra tax on undistributed foreign earnings and deal costs.

Sales grew 51% to $1.47 B, but the cost of what ITT sells grew 55%, so gross margin slipped. Management credits the SPX FLOW acquisition, along with volume and pricing, for the gross profit gain. Selling and overhead costs took 15.7% of sales this quarter, up from 14.1% a year earlier. Will SPX FLOW's earnings grow fast enough to shrink the interest bill's share of profit, or will interest keep eating it?

The mechanism is simple: more debt, more interest, and less of each operating dollar left after tax. Operating profit covered interest 13.9 times a year earlier, and covers it only 3.6 times now. For an investor, the question is whether the bought growth earns its financing cost and, after that, its tax bill. Will SPX FLOW's earnings grow fast enough to cover this interest bill without new borrowing, or will the bill keep growing?
2026-04-05 to 2026-07-04

Revenue by Product and Service

Swipe to see the full flow
ITT INC. (ITT) FY2026 Q2 P&L / Income StatementIncome statement for 2026-04-05 through 2026-07-04. View: Product and service. Revenue uses this breakdown; costs and expenses retain the consolidated categories.SOURCESREVENUEGROSSOPERATINGPRE-TAXNETAuto and railChemical and industrial pumpsEnergyNutrition and healthAerospace and defenseGeneral industrialRevenueGross profitCost of revenueOperating incomeOperating expenses (calculated)General and administrative expensesSales and marketing expensesIntangible amortizationResearch and development expensesIncome before income tax expenseOther income (expense), net (calculated)Net incomeIncome tax expenseIncome before income tax expenseIncome beforeincome tax expense$135.20 MRevenueRevenue$1.47 BGross profitGross profit$510.10 MOperating incomeOperating income$180.30 MNet incomeNet income$86.50 MAuto and railAuto and rail$380.90 MOperating expenses (calculated)Operating expenses(calculated)$329.80 MIncome tax expenseIncome tax expense$48.70 MChemical and industrial pumpsChemical and industrial pumps$333.30 MGeneral and administrative expensesGeneral andadministrative expenses$143.90 MOther income (expense), net (calculated)Other income,net (calculated)−$45.10 MCost of revenueCost of revenue$963.00 MSales and marketing expensesSales and marketing expenses$87.50 MEnergyEnergy$258.60 MIntangible amortizationIntangible amortization$62.60 MNutrition and healthNutrition and health$215.10 MResearch and development expensesResearch anddevelopment expenses$35.80 MAerospace and defenseAerospace and defense$208.70 MGeneral industrialGeneral industrial$76.50 M
Chart details

ITT INC. (ITT) FY2026 Q2 P&L / Income Statement

Income statement for 2026-04-05 through 2026-07-04. View: Product and service. Revenue uses this breakdown; costs and expenses retain the consolidated categories.

Revenue
1,473,100,000 US dollars
Cost of revenue
963,000,000 US dollars
Gross profit
510,100,000 US dollars
Operating expenses (calculated)
329,800,000 US dollars
Operating income
180,300,000 US dollars
Other income (expense), net (calculated)
negative 45,100,000 US dollars
Income before income tax expense
135,200,000 US dollars
Income tax expense
48,700,000 US dollars
Net income
86,500,000 US dollars
Auto and rail
380,900,000 US dollars
Chemical and industrial pumps
333,300,000 US dollars
Energy
258,600,000 US dollars
Aerospace and defense
208,700,000 US dollars
Nutrition and health
215,100,000 US dollars
General industrial
76,500,000 US dollars
General and administrative expenses
143,900,000 US dollars
Sales and marketing expenses
87,500,000 US dollars
Research and development expenses
35,800,000 US dollars
Intangible amortization
62,600,000 US dollars

Chart connections

  • Revenue less cost of revenue equals gross profit; gross profit less operating expenses equals operating income.
  • Operating income plus other income or expense equals income before tax. Income before tax less income tax expense or benefit equals net income.
  • Of which attributable to ITT INC.: $84.90 M; to noncontrolling interests: $1.60 M.
ITT INC. (ITT) FY2026 Q2 P&L / Income Statement Sankey chart, Product and service view
Free to share unchanged, with credit to Plicit.ai · CC BY-NC-ND 4.0Download PNG

Intelligent Insights for Investors

How much of ITT's profit comes from its main business?

Its main business earned $180.30 M of operating income this quarter, before interest and taxes. Interest and other items then took away a net $45.10 M, led by $49.70 M of interest expense.

Did a lower tax rate drive ITT's profit growth?

No: its tax rate rose to 36.0% this quarter from 25.9% a year earlier. Profit after tax fell from $121.70 M to $86.50 M, while profit before tax fell from $164.20 M to $135.20 M.

Does ITT earn enough to cover its interest payments?

Yes: its operating profit covered its interest 3.6 times this quarter, against 13.9 times a year earlier. The cushion is thinner, though it has not yet run out.

Intelligent Insights for Lenders

Are interest payments eating up more of ITT's operating profit?

Yes: interest took 28% of operating profit this quarter, against 7% a year earlier. Interest expense rose by $37.10 M, while operating profit gained only $5.20 M.

Intelligent Insights for Employees

Are ITT's overhead and selling costs falling as a share of sales?

No: selling and overhead costs took 15.7% of sales this quarter, up from 14.1% a year earlier. Those costs are the people and offices that run the business, and they took a bigger share of each sales dollar.

Product waitlist

Health Check and Teardown for your own company

A health check uncovers insights of your private books, not a public ticker. Join this list to get notified as soon as we go-live!