
JABIL INC (JBL) FY2026 Annual P&L / Income Statement

Published · Updated Source: Form 10-K on SEC EDGAR filed (opens in a new tab)

Key Takeaways

  • China fell 2.7% to $4.08 B while total sales rose 21%, and Malaysia overtook it.
  • Three foreign countries each brought in 11% or more of sales: Mexico 20%, Malaysia 12%, China 11%.
  • Outside the United States came 73% of sales, down from 75% a year earlier.
  • The Other group holds 39% of long-term assets but brings in 30% of sales.

The Unvarnished Truth

Jabil's China sales shrank while revenue grew 21%

Jabil's China line is shrinking inside a fast-growing company. Sales to China fell 2.7% to $4.08 B, even as total revenue rose 21%. Its sales were $4.20 B a year earlier. China's share of sales fell to 11% from 14%. In the same year Malaysia climbed to $4.38 B and passed China to become the fourth-largest part of the view. Malaysia added $732.00 M, while China lost $114.00 M. A shrinking piece inside a growing whole is easy to miss in the headline number.

The biggest single source of growth was the United States. It rose 30% to $9.67 B and added $2.23 B, more than any other part of the view. The United States is 27% of sales on its own. The Other group rose 20%, to $10.62 B. Mexico, the largest single foreign country, brought in 20% of sales. The view names the countries, but it does not say which customers or sites sit behind the shift in China, or why Malaysia gained the share China lost.

Put the pieces together. The Other group holds 39% of long-term assets but brings in 30% of sales, so the sales view and the asset view do not line up. China is the part that shrank, and 73% of sales come from outside the United States. The Other group grew 20% and the United States 30%, while China shrank. Will the China decline keep widening as Malaysia takes more share, or is it a one-year dip inside a company still growing at home?
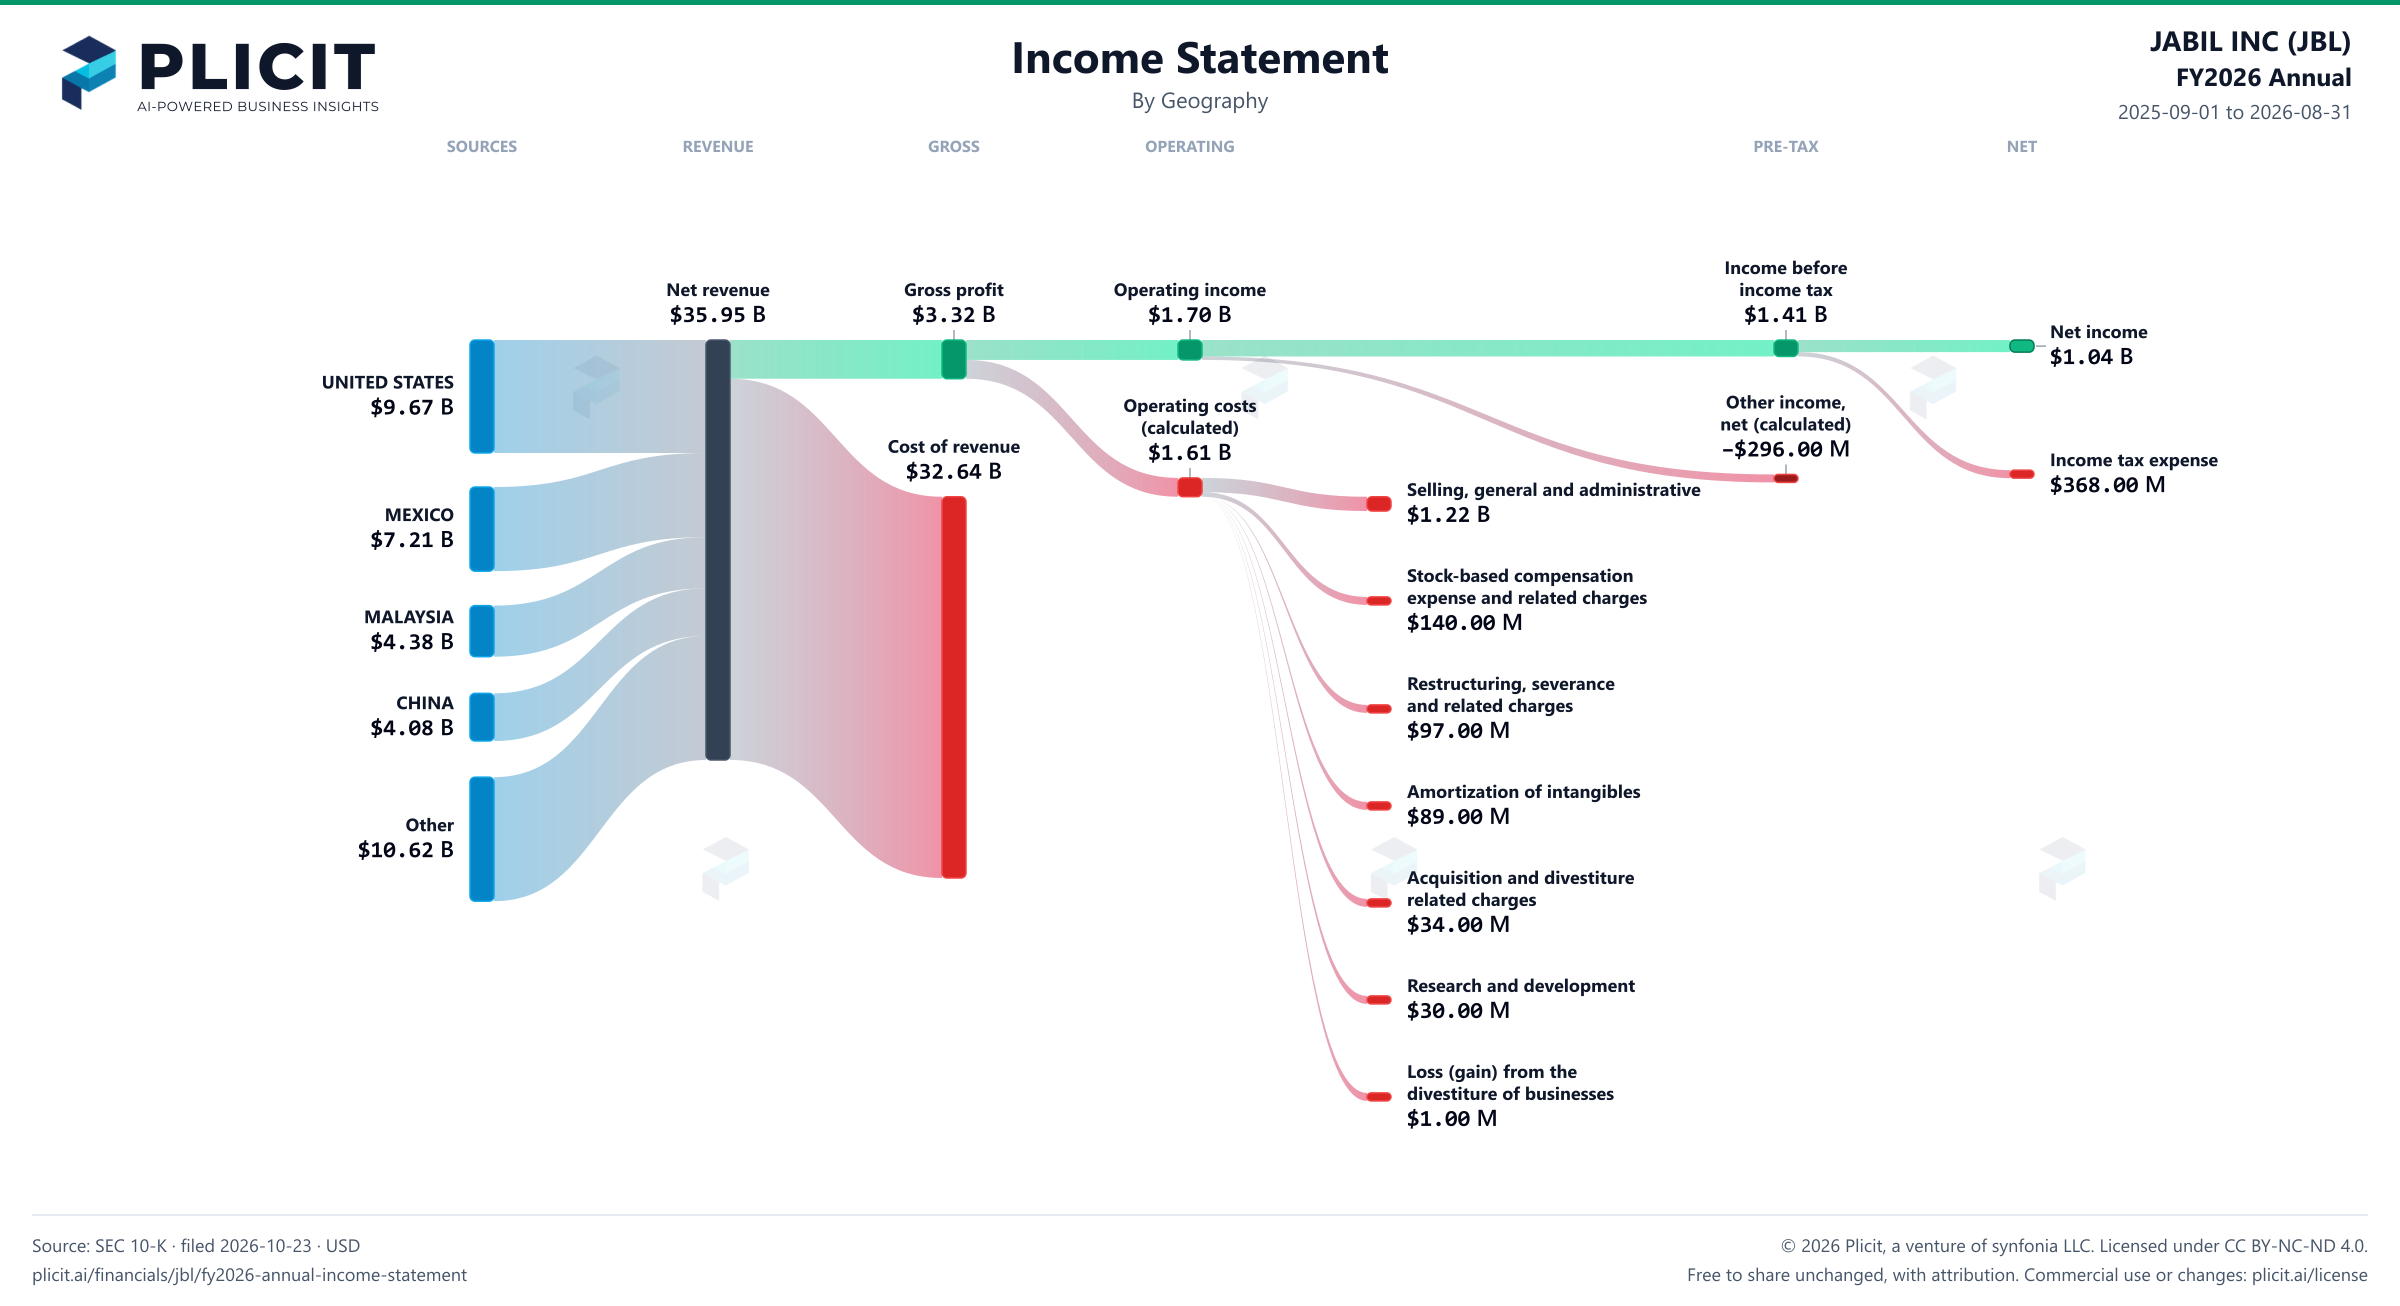
Revenue by Geography

Swipe to see the full flow
JABIL INC (JBL) FY2026 Annual P&L / Income StatementIncome statement for 2025-09-01 through 2026-08-31. View: Geography. Revenue uses this breakdown; costs and expenses retain the consolidated categories.SOURCESREVENUEGROSSOPERATINGPRE-TAXNETUNITED STATESMEXICOMALAYSIACHINAOtherNet revenueGross profitCost of revenueOperating incomeOperating costs, including other operating expenses (calculated)Selling, general and administrativeStock-based compensation expense and related chargesRestructuring, severance and related chargesAmortization of intangiblesAcquisition and divestiture related chargesResearch and developmentLoss (gain) from the divestiture of businessesIncome before income taxOther income (expense), net (calculated)Net incomeIncome tax expenseIncome before income taxIncome beforeincome tax$1.41 BNet revenueNet revenue$35.95 BGross profitGross profit$3.32 BOperating incomeOperating income$1.70 BNet incomeNet income$1.04 BUNITED STATESUNITED STATES$9.67 BOperating costs, including other operating expenses (calculated)Operating costs(calculated)$1.61 BCost of revenueCost of revenue$32.64 BIncome tax expenseIncome tax expense$368.00 MSelling, general and administrativeSelling, general and administrative$1.22 BOther income (expense), net (calculated)Other income,net (calculated)−$296.00 MMEXICOMEXICO$7.21 BStock-based compensation expense and related chargesStock-based compensationexpense and related charges$140.00 MMALAYSIAMALAYSIA$4.38 BRestructuring, severance and related chargesRestructuring, severanceand related charges$97.00 MCHINACHINA$4.08 BAmortization of intangiblesAmortization of intangibles$89.00 MOtherOther$10.62 BAcquisition and divestiture related chargesAcquisition and divestiturerelated charges$34.00 MResearch and developmentResearch and development$30.00 MLoss (gain) from the divestiture of businessesLoss (gain) from thedivestiture of businesses$1.00 M
Chart details

JABIL INC (JBL) FY2026 Annual P&L / Income Statement

Income statement for 2025-09-01 through 2026-08-31. View: Geography. Revenue uses this breakdown; costs and expenses retain the consolidated categories.

Net revenue
35,954,000,000 US dollars
Cost of revenue
32,637,000,000 US dollars
Gross profit
3,317,000,000 US dollars
Operating costs, including other operating expenses (calculated)
1,613,000,000 US dollars
Operating income
1,704,000,000 US dollars
Other income (expense), net (calculated)
negative 296,000,000 US dollars
Income before income tax
1,408,000,000 US dollars
Income tax expense
368,000,000 US dollars
Net income
1,040,000,000 US dollars
UNITED STATES
9,674,000,000 US dollars
MEXICO
7,205,000,000 US dollars
MALAYSIA
4,376,000,000 US dollars
CHINA
4,082,000,000 US dollars
Other
10,617,000,000 US dollars
Selling, general and administrative
1,222,000,000 US dollars
Stock-based compensation expense and related charges
140,000,000 US dollars
Research and development
30,000,000 US dollars
Amortization of intangibles
89,000,000 US dollars
Restructuring, severance and related charges
97,000,000 US dollars
Acquisition and divestiture related charges
34,000,000 US dollars
Loss (gain) from the divestiture of businesses
1,000,000 US dollars

Chart connections

  • Revenue less cost of revenue equals gross profit; gross profit less operating expenses equals operating income.
  • Operating income plus other income or expense equals income before tax. Income before tax less income tax expense or benefit equals net income.
  • Of which attributable to JABIL INC: $1.04 B; to noncontrolling interests: −$2.00 M.
JABIL INC (JBL) FY2026 Annual Revenue by Geography Sankey chart
Free to share unchanged, with credit to Plicit.ai · CC BY-NC-ND 4.0Download PNG

Intelligent Insights for Investors

How much of Jabil's sales come from outside its home country?

Most of them: 73% of Jabil's sales this year came from outside the United States, against 75% a year earlier. The United States brought in $9.67 B, and the rest came to $26.28 B.

Did any part of Jabil's sales by region overtake another over the past year?

Yes: Malaysia passed China to become the fourth-largest part, at $4.38 B against China's $4.08 B this year. A year earlier Malaysia was at $3.64 B, below China's $4.20 B.

Has any part of Jabil's sales by region grown or shrunk quarter after quarter?

Other has grown two years running, to $10.62 B this year from $8.67 B two years earlier. Its share of sales is 30%.

Intelligent Insights for Employees

Which part of Jabil's sales by region grew fastest over the past year?

The United States grew 30% this year, against 21% for these sales as a whole. In dollars it grew by $2.23 B.

Intelligent Insights for Suppliers

How much does Jabil depend on the biggest piece of its sales by region?

Not much: Other brought in 30% of these sales this year, against 27% for the United States, the next largest. No single part carries the business.

Intelligent Insights for Everyone

Which single foreign countries bring in the most of Jabil's sales?

Mexico brought in 20% of sales this year and Malaysia 12%, with China at 11%. Three foreign countries each bring in 11% or more of sales.

Product waitlist

Health Check and Teardown for your own company

A health check uncovers insights of your private books, not a public ticker. Join this list to get notified as soon as we go-live!