
Jones Lang LaSalle Incorporated (JLL) FY2026 Q2 Balance Sheet
As of 2026-06-30
Balance Sheet
As of 2026-06-30
Swipe to see the full flow
Chart details
Jones Lang LaSalle Incorporated (JLL) FY2026 Q2 Balance Sheet
Balance sheet as of 2026-06-30. The chart shows assets, liabilities and equity at that date.
- Assets
- 17,464,200,000 US dollars
- Current assets
- 7,825,900,000 US dollars
- Non-current assets
- 9,638,300,000 US dollars
- Liabilities
- 9,863,900,000 US dollars
- Current liabilities
- 6,951,500,000 US dollars
- Non-current liabilities
- 2,912,400,000 US dollars
- Equity
- 7,600,300,000 US dollars
- Noncontrolling interest
- 138,600,000 US dollars. Included in consolidated equity; this amount is not added again.
- Accounts Receivable, Reimbursed by Client, Current
- 3,090,600,000 US dollars
- Trade receivables, net of allowances
- 2,233,500,000 US dollars
- Loans Receivable, Gross, Mortgage Warehouse Lending.
- 700,300,000 US dollars
- Prepaid Expense and Other Assets, Current
- 557,100,000 US dollars
- Cash and cash equivalents
- 458,200,000 US dollars
- Notes and other receivables
- 434,900,000 US dollars
- Contract with Customer, Asset, after Allowance for Credit Loss, Current
- 351,300,000 US dollars
- Goodwill
- 4,726,700,000 US dollars
- Investments
- 873,600,000 US dollars
- Deferred Compensation Plan Assets
- 797,200,000 US dollars
- Operating Lease, Right-of-Use Asset
- 670,400,000 US dollars
- Identified intangibles, net of accumulated amortization
- 635,700,000 US dollars
- Property and equipment, net of accumulated depreciation
- 635,500,000 US dollars
- Deferred Income Tax Assets, Net
- 600,700,000 US dollars
- Long-term receivables
- 434,300,000 US dollars
- Other
- 264,200,000 US dollars
- Accounts Payable, Reimbursed by Client, Current
- 2,283,500,000 US dollars
- Accrued compensation & benefits
- 1,316,300,000 US dollars
- Accounts Payable and Accrued Liabilities, Current
- 1,243,100,000 US dollars
- Warehouse facilities
- 700,300,000 US dollars
- Commercial Paper
- 420,000,000 US dollars
- Other
- 274,400,000 US dollars
- Short-term contract liabilities and deferred income
- 270,600,000 US dollars
- Long-term Debt, Current Maturities
- 199,900,000 US dollars
- Operating Lease, Liability, Current
- 160,000,000 US dollars
- Short-term Debt
- 83,400,000 US dollars
- Deferred compensation
- 786,600,000 US dollars
- Operating Lease, Liability, Noncurrent
- 720,900,000 US dollars
- Long-term debt, net of debt issuance costs
- 596,400,000 US dollars
- Other
- 404,000,000 US dollars
- Long-term Line of Credit, Noncurrent, Net of Debt Issuance Costs
- 338,000,000 US dollars
- Deferred Tax Liabilities, Net
- 66,500,000 US dollars
- Retained earnings
- 7,443,300,000 US dollars
- Additional paid-in capital
- 2,057,700,000 US dollars
- Common stock, $.01 par value per share
- 500,000 US dollars
- Noncontrolling interest
- 138,600,000 US dollars
- Treasury Stock, Value
- negative 1,434,900,000 US dollars
- Accumulated Other Comprehensive Income (Loss), Net of Tax
- negative 591,100,000 US dollars
- Shares held in trust
- negative 13,800,000 US dollars
- Gross equity (calculated)
- 9,640,100,000 US dollars. Net equity plus the magnitudes of its negative contributions equals gross positive equity. The negative contributions enter this reconciliation as add-backs; their filed signs stay negative.
Chart connections
- Assets equal liabilities plus consolidated equity. Consolidated equity includes noncontrolling interests when reported.
- Treasury shares and other negative equity contributions reduce equity.
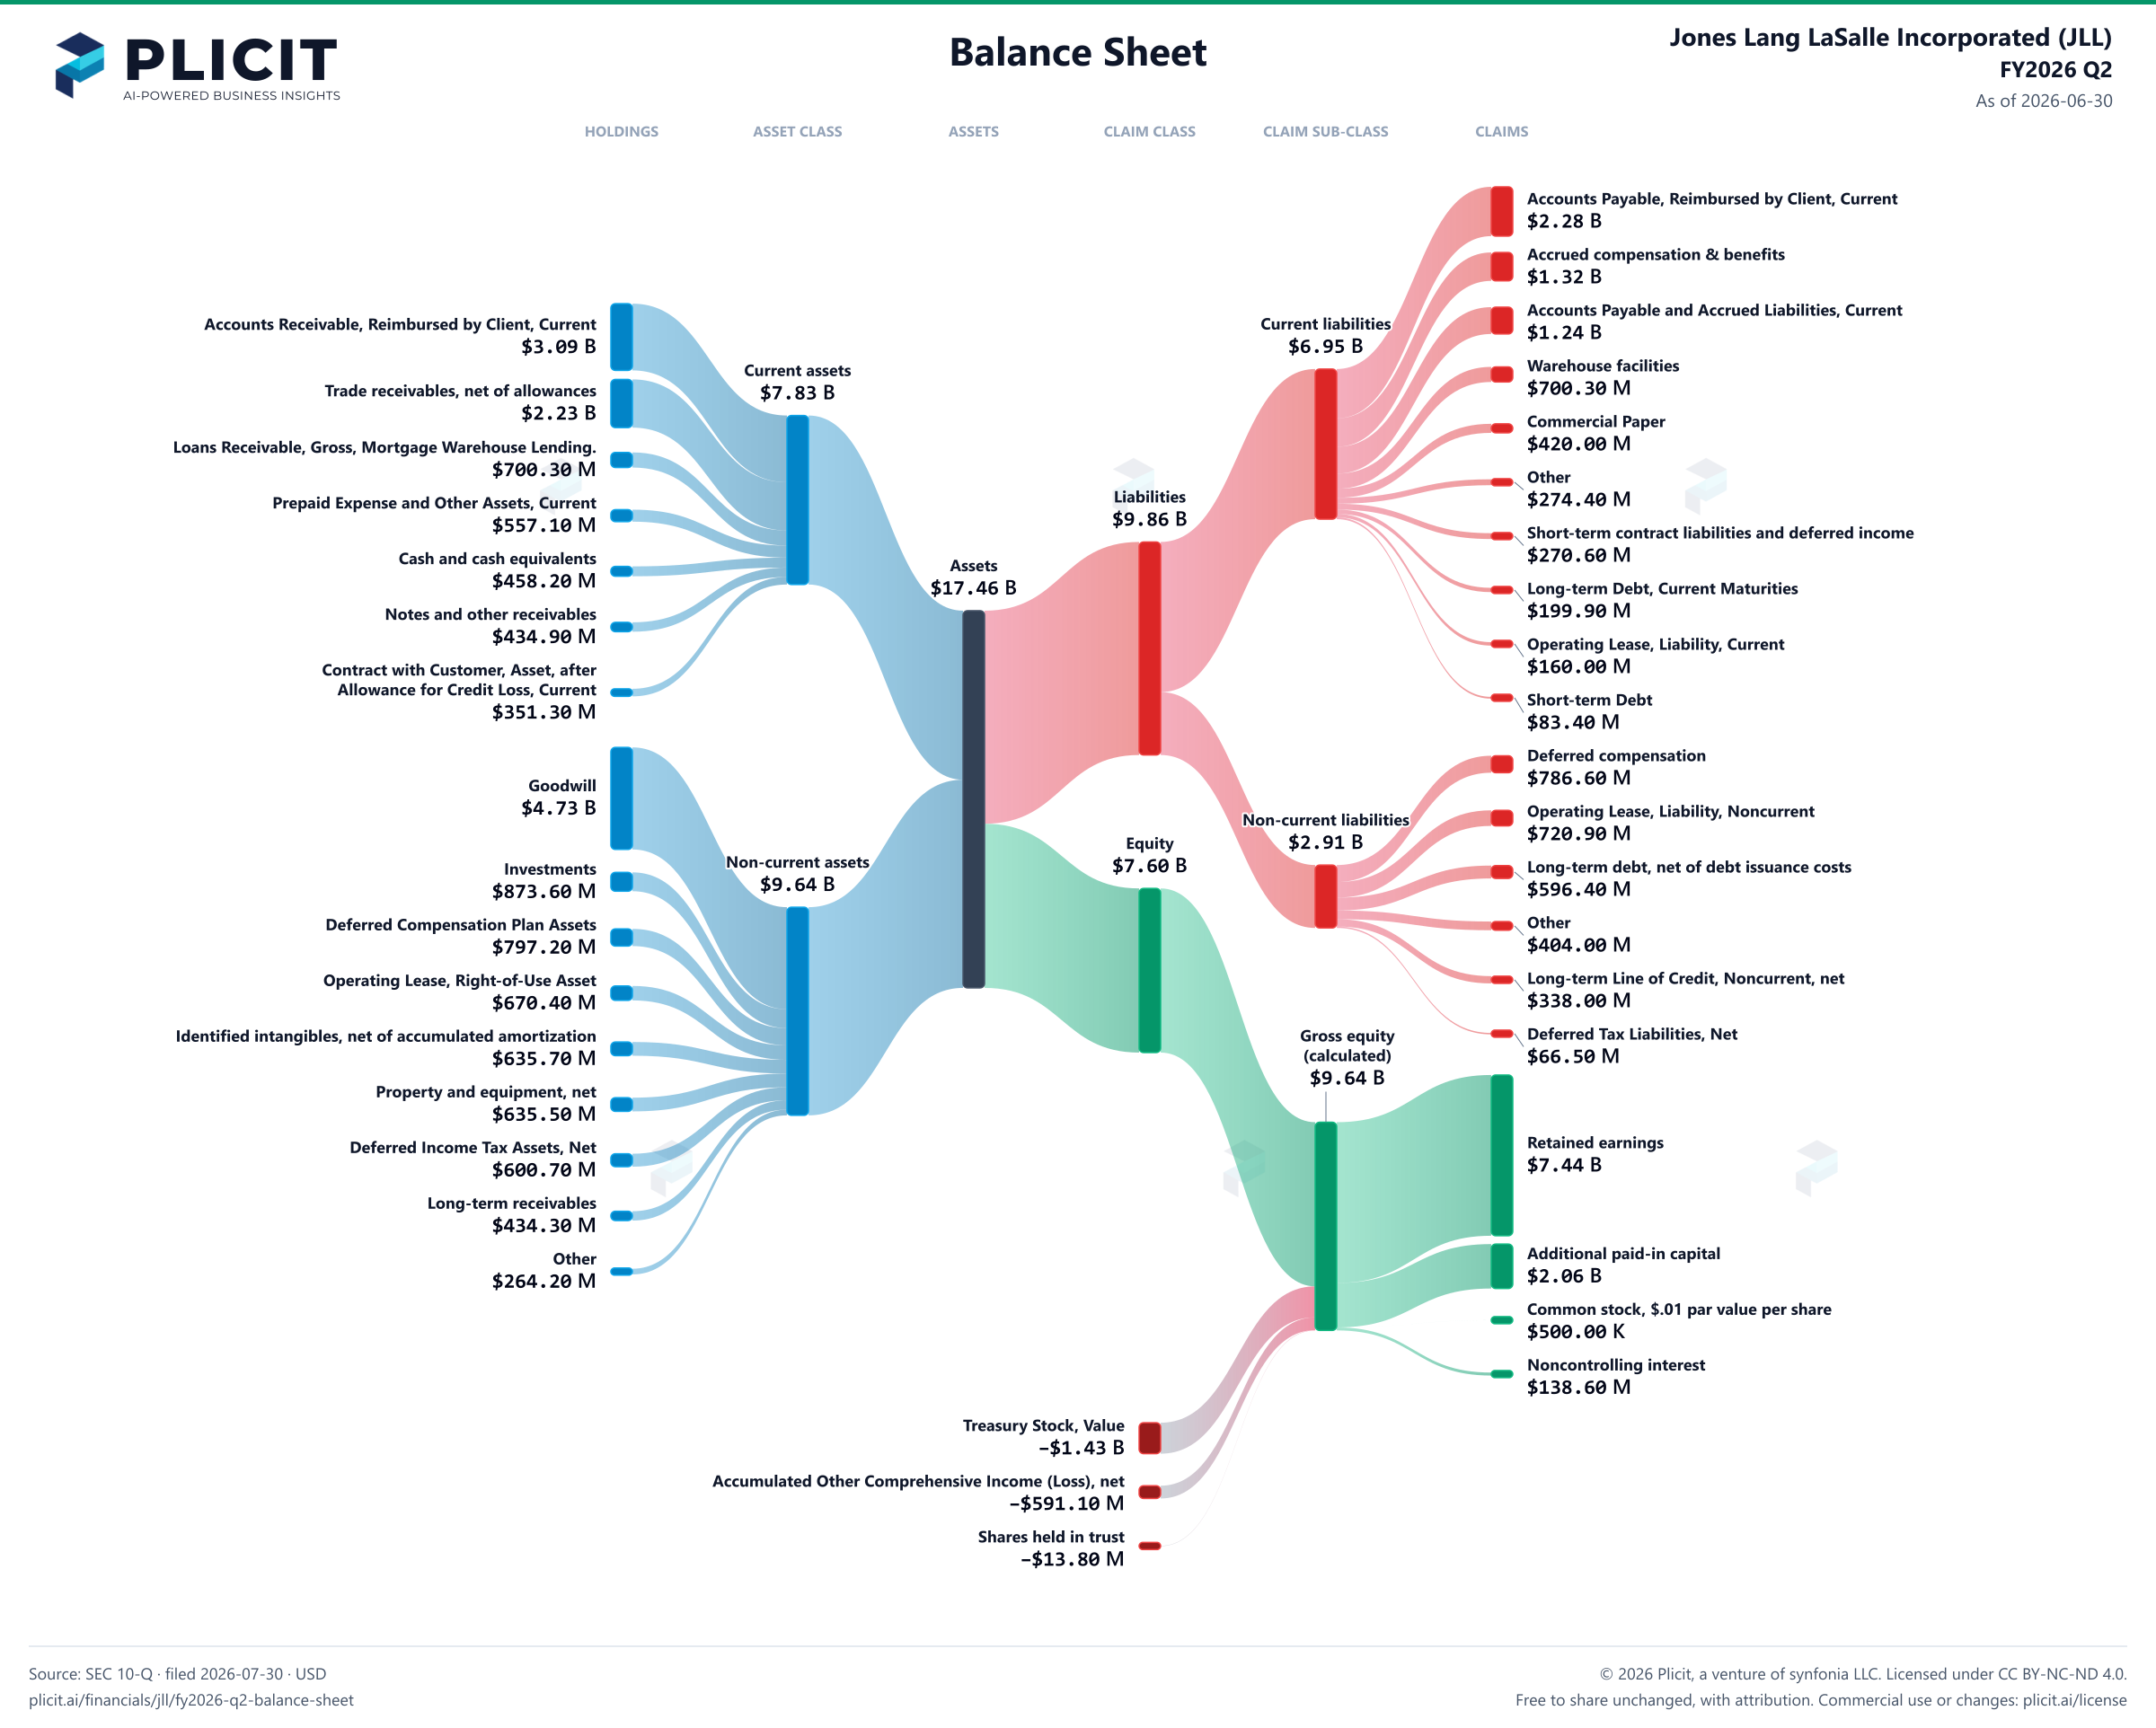
Free to share unchanged, with credit to Plicit.ai · CC BY-NC-ND 4.0Download PNG
Product waitlist
Health Check and Teardown for your own company
A health check uncovers insights of your private books, not a public ticker. Join this list to get notified as soon as we go-live!