
Jones Lang LaSalle Incorporated (JLL) FY2026 Q2 P&L / Income Statement

Revenue by Business Segment by Business Line

2026-04-01 to 2026-06-30

Swipe to see the full flow
Jones Lang LaSalle Incorporated (JLL) FY2026 Q2 P&L / Income StatementIncome statement for 2026-04-01 through 2026-06-30. View: Segments by Business Line. Revenue uses this breakdown; costs and expenses retain the consolidated categories.SOURCESREVENUEOPERATINGPRE-TAXNETReal Estate Management Services - Workplace ManagementReal Estate Management Services - Project ManagementLeasing AdvisoryCapital Markets Services - Investment Sales, Debt/Equity Advisory and OtherReal Estate Management Services - Property ManagementReal Estate Management Services - Portfolio Services and OtherCapital Markets Services - Value and Risk AdvisoryInvestment Management - Advisory FeesReal Estate Management Services - Software and Technology SolutionsCapital Markets Services - Loan ServicingInvestment Management - Incentive and transaction feesRevenueOperating Income (Loss)Total operating expensesTotal operating expensesIncome before income taxes and noncontrolling interestOther income (expense), net (calculated)Net incomeProvision for income taxesIncome before income taxes and noncontrolling interestIncome beforeincome taxes andnoncontrolling interest$265.60 MOperating Income (Loss)OperatingIncome (Loss)$290.90 MRevenueRevenue$6.93 BNet incomeNet income$214.30 MTotal operating expensesTotal operatingexpenses$6.64 BReal Estate Management Services - Workplace ManagementReal Estate Management Services- Workplace Management$3.71 BProvision for income taxesProvision forincome taxes$51.30 MOther income (expense), net (calculated)Other income,net (calculated)−$25.30 MReal Estate Management Services - Project ManagementReal Estate ManagementServices - Project Management$1.01 BTotal operating expensesTotal operating expenses$6.64 BLeasing AdvisoryLeasing Advisory$836.90 MCapital Markets Services - Investment Sales, Debt/Equity Advisory and OtherCapital Markets Services -Investment Sales, Debt/EquityAdvisory and Other$472.20 MReal Estate Management Services - Property ManagementReal Estate ManagementServices - Property Management$468.60 MReal Estate Management Services - Portfolio Services and OtherReal Estate Management Services- Portfolio Services and Other$120.60 MCapital Markets Services - Value and Risk AdvisoryCapital Markets Services- Value and Risk Advisory$102.70 MInvestment Management - Advisory FeesInvestment Management- Advisory Fees$94.30 MReal Estate Management Services - Software and Technology SolutionsReal Estate Management Services -Software and Technology Solutions$58.10 MCapital Markets Services - Loan ServicingCapital Markets Services- Loan Servicing$45.30 MInvestment Management - Incentive and transaction feesInvestment Management -Incentive and transaction fees$8.10 M
Chart details

Jones Lang LaSalle Incorporated (JLL) FY2026 Q2 P&L / Income Statement

Income statement for 2026-04-01 through 2026-06-30. View: Segments by Business Line. Revenue uses this breakdown; costs and expenses retain the consolidated categories.

Revenue
6,927,900,000 US dollars
Total operating expenses
6,637,000,000 US dollars
Operating Income (Loss)
290,900,000 US dollars
Other income (expense), net (calculated)
negative 25,300,000 US dollars
Income before income taxes and noncontrolling interest
265,600,000 US dollars
Provision for income taxes
51,300,000 US dollars
Net income
214,300,000 US dollars
Leasing Advisory
836,900,000 US dollars
Capital Markets Services - Investment Sales, Debt/Equity Advisory and Other
472,200,000 US dollars
Capital Markets Services - Loan Servicing
45,300,000 US dollars
Capital Markets Services - Value and Risk Advisory
102,700,000 US dollars
Investment Management - Advisory Fees
94,300,000 US dollars
Investment Management - Incentive and transaction fees
8,100,000 US dollars
Real Estate Management Services - Portfolio Services and Other
120,600,000 US dollars
Real Estate Management Services - Project Management
1,013,400,000 US dollars
Real Estate Management Services - Property Management
468,600,000 US dollars
Real Estate Management Services - Software and Technology Solutions
58,100,000 US dollars
Real Estate Management Services - Workplace Management
3,707,700,000 US dollars
Total operating expenses
6,637,000,000 US dollars

Chart connections

  • Revenue minus operating expenses equals operating income.
  • Operating income plus other income or expense equals income before tax. Income before tax less income tax expense or benefit equals net income.
  • Of which attributable to Jones Lang LaSalle Incorporated: $215.60 M; to noncontrolling interests: −$1.30 M.
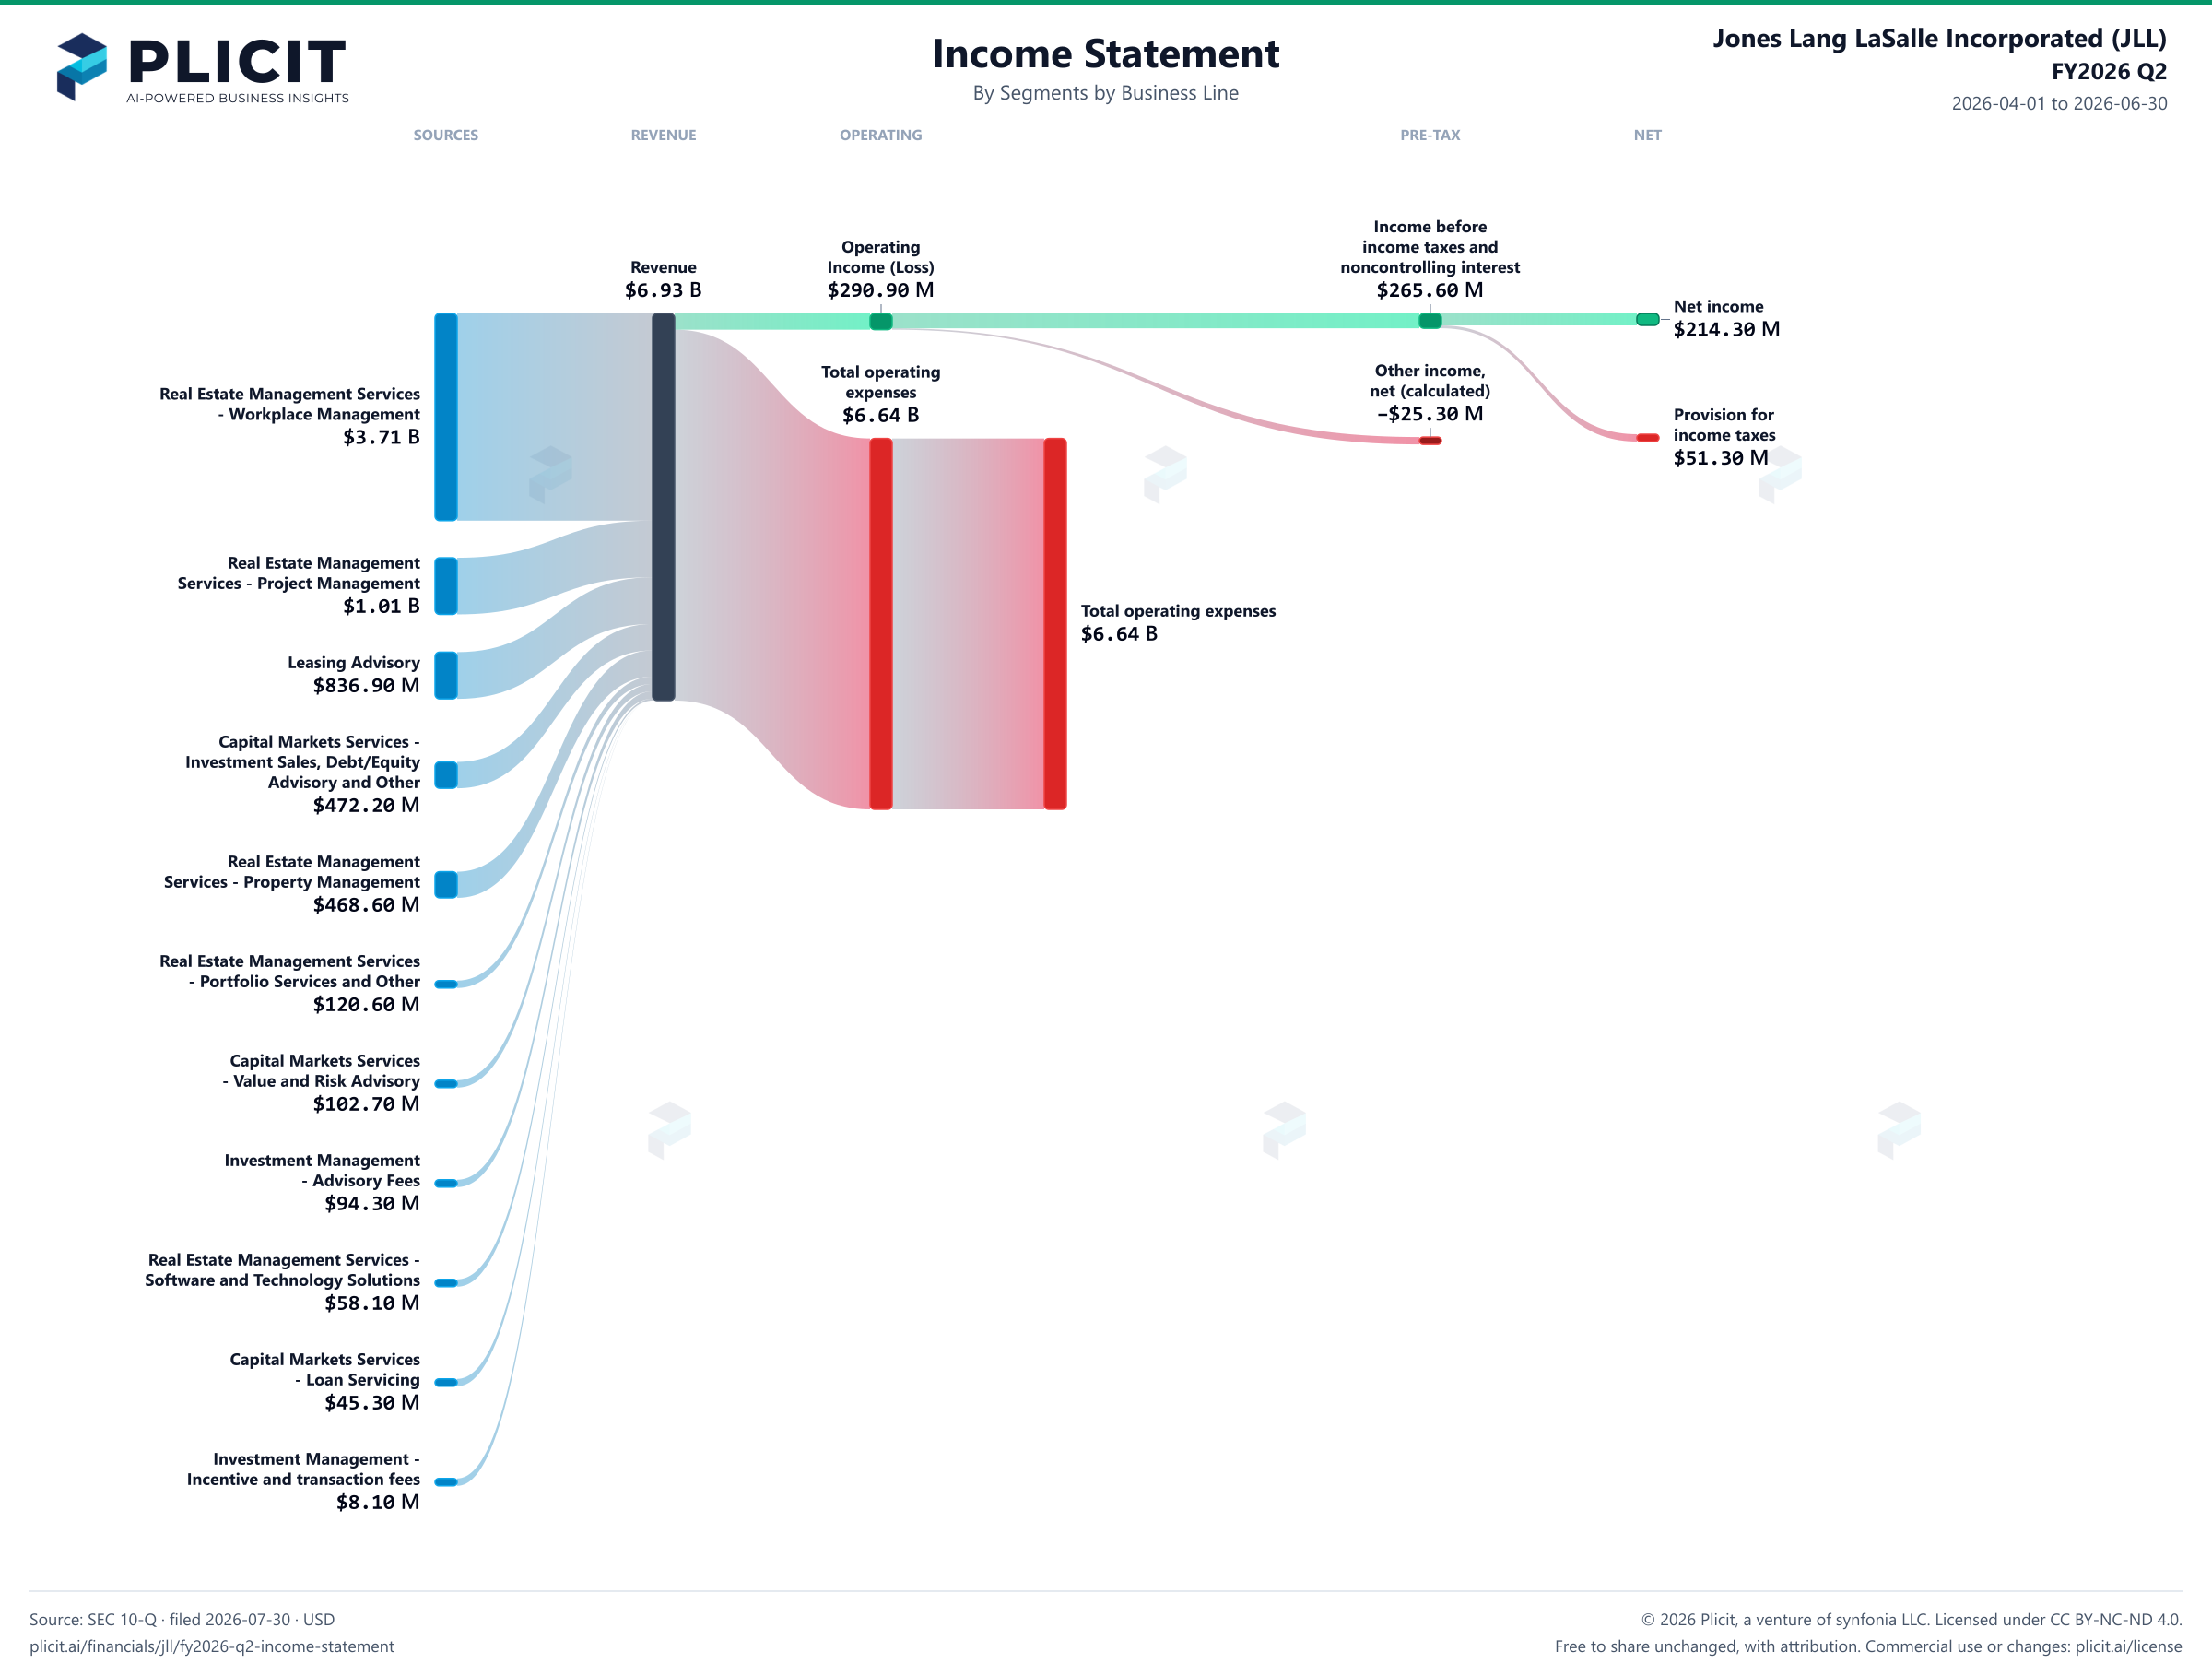
Jones Lang LaSalle Incorporated (JLL) FY2026 Q2 P&L / Income Statement Sankey chart, Segments by Business Line view
Free to share unchanged, with credit to Plicit.ai · CC BY-NC-ND 4.0Download PNG

Operating margin

4.2%

Operating profit / revenue

Cash conversion

227.8%

Operating cash / net income, same period

Newsletter

Get the teardowns by email

Subscribe if you want the public-company teardowns in your inbox when they're released.

Product waitlist

Health Check and Teardown for your own company

A health check uncovers insights of your private books, not a public ticker. Join this list to get notified as soon as we go-live!