
KBR, Inc. (KBR) FY2026 Q2 P&L / Income Statement

2026-04-04 to 2026-07-03

Swipe to see the full flow
KBR, Inc. (KBR) FY2026 Q2 P&L / Income StatementIncome statement for 2026-04-04 through 2026-07-03. View: Business segment by customer. Revenue uses this breakdown; costs and expenses retain the consolidated categories.SOURCESREVENUEGROSSOPERATINGPRE-TAXNETMission Technology Solutions - U.S. Government Defense and Intelligence ClientsSustainable Technology Solutions - Commercial and Infrastructure ClientsMission Technology Solutions - U.S. Government Federal Civilian ClientsMission Technology Solutions - International Government ClientsSustainable Technology Solutions - International Government ClientsMission Technology Solutions - Commercial and Infrastructure ClientsRevenuesGross profitCost of revenuesOperating incomeOperating costs, net of other operating income (calculated)Selling, general and administrative expensesEquity in earnings of unconsolidated affiliatesSpin-off costs and other chargesOther operating income (expense)Income (loss) from continuing operations before income taxesOther income (expense), net (calculated)Net incomeProvision for income taxesNet income (loss) from discontinued operations, net of taxNet income (loss) from discontinued operations, net of taxNet income (loss)from discontinuedoperations, net of tax$2.00 MIncome (loss) from continuing operations before income taxesIncome (loss) fromcontinuing operationsbefore income taxes$135.00 MRevenuesRevenues$1.98 BGross profitGross profit$293.00 MOperating incomeOperating income$172.00 MNet incomeNet income$99.00 MMission Technology Solutions - U.S. Government Defense and Intelligence ClientsMTS - U.S. Government Defenseand Intelligence Clients$834.00 MOperating costs, net of other operating income (calculated)Operating costs,net (calculated)$121.00 MProvision for income taxesProvision forincome taxes$38.00 MCost of revenuesCost of revenues$1.69 BSelling, general and administrative expensesSelling, general andadministrative expenses$143.00 MOther income (expense), net (calculated)Other income,net (calculated)−$37.00 MEquity in earnings of unconsolidated affiliatesEquity in earnings ofunconsolidated affiliates−$52.00 MSustainable Technology Solutions - Commercial and Infrastructure ClientsSustainable TechnologySolutions - Commercialand Infrastructure Clients$638.00 MMission Technology Solutions - U.S. Government Federal Civilian ClientsMTS - U.S. GovernmentFederal Civilian Clients$254.00 MSpin-off costs and other chargesSpin-off costs and other charges$31.00 MOther operating income (expense)Other operating income (expense)−$1.00 MMission Technology Solutions - International Government ClientsMTS - InternationalGovernment Clients$199.00 MSustainable Technology Solutions - International Government ClientsSustainable Technology Solutions- International Government Clients$38.00 MMission Technology Solutions - Commercial and Infrastructure ClientsMTS - Commercial andInfrastructure Clients$21.00 M
Chart details

KBR, Inc. (KBR) FY2026 Q2 P&L / Income Statement

Income statement for 2026-04-04 through 2026-07-03. View: Business segment by customer. Revenue uses this breakdown; costs and expenses retain the consolidated categories.

Revenues
1,984,000,000 US dollars
Cost of revenues
1,691,000,000 US dollars
Gross profit
293,000,000 US dollars
Operating costs, net of other operating income (calculated)
121,000,000 US dollars
Operating income
172,000,000 US dollars
Other income (expense), net (calculated)
negative 37,000,000 US dollars
Income (loss) from continuing operations before income taxes
135,000,000 US dollars
Provision for income taxes
38,000,000 US dollars
Net income
99,000,000 US dollars
Corporate
0 US dollars
Mission Technology Solutions - Commercial and Infrastructure Clients
21,000,000 US dollars
Mission Technology Solutions - International Government Clients
199,000,000 US dollars
Mission Technology Solutions - U.S. Government Defense and Intelligence Clients
834,000,000 US dollars
Mission Technology Solutions - U.S. Government Federal Civilian Clients
254,000,000 US dollars
Sustainable Technology Solutions - Commercial and Infrastructure Clients
638,000,000 US dollars
Sustainable Technology Solutions - International Government Clients
38,000,000 US dollars
Sustainable Technology Solutions - U.S. Government Defense and Intelligence Clients
0 US dollars
Sustainable Technology Solutions - U.S. Government Federal Civilian Clients
0 US dollars
Selling, general and administrative expenses
143,000,000 US dollars
Spin-off costs and other charges
31,000,000 US dollars
Equity in earnings of unconsolidated affiliates
negative 52,000,000 US dollars
Other operating income (expense)
negative 1,000,000 US dollars
Net income (loss) from discontinued operations, net of tax
2,000,000 US dollars. Reported below-tax contribution to net income.

Chart connections

  • Revenue less cost of revenue equals gross profit; gross profit less operating expenses equals operating income.
  • Operating income plus other income or expense equals income before tax. Income before tax less income tax expense or benefit, plus the explicitly reported below-tax contributions, equals net income.
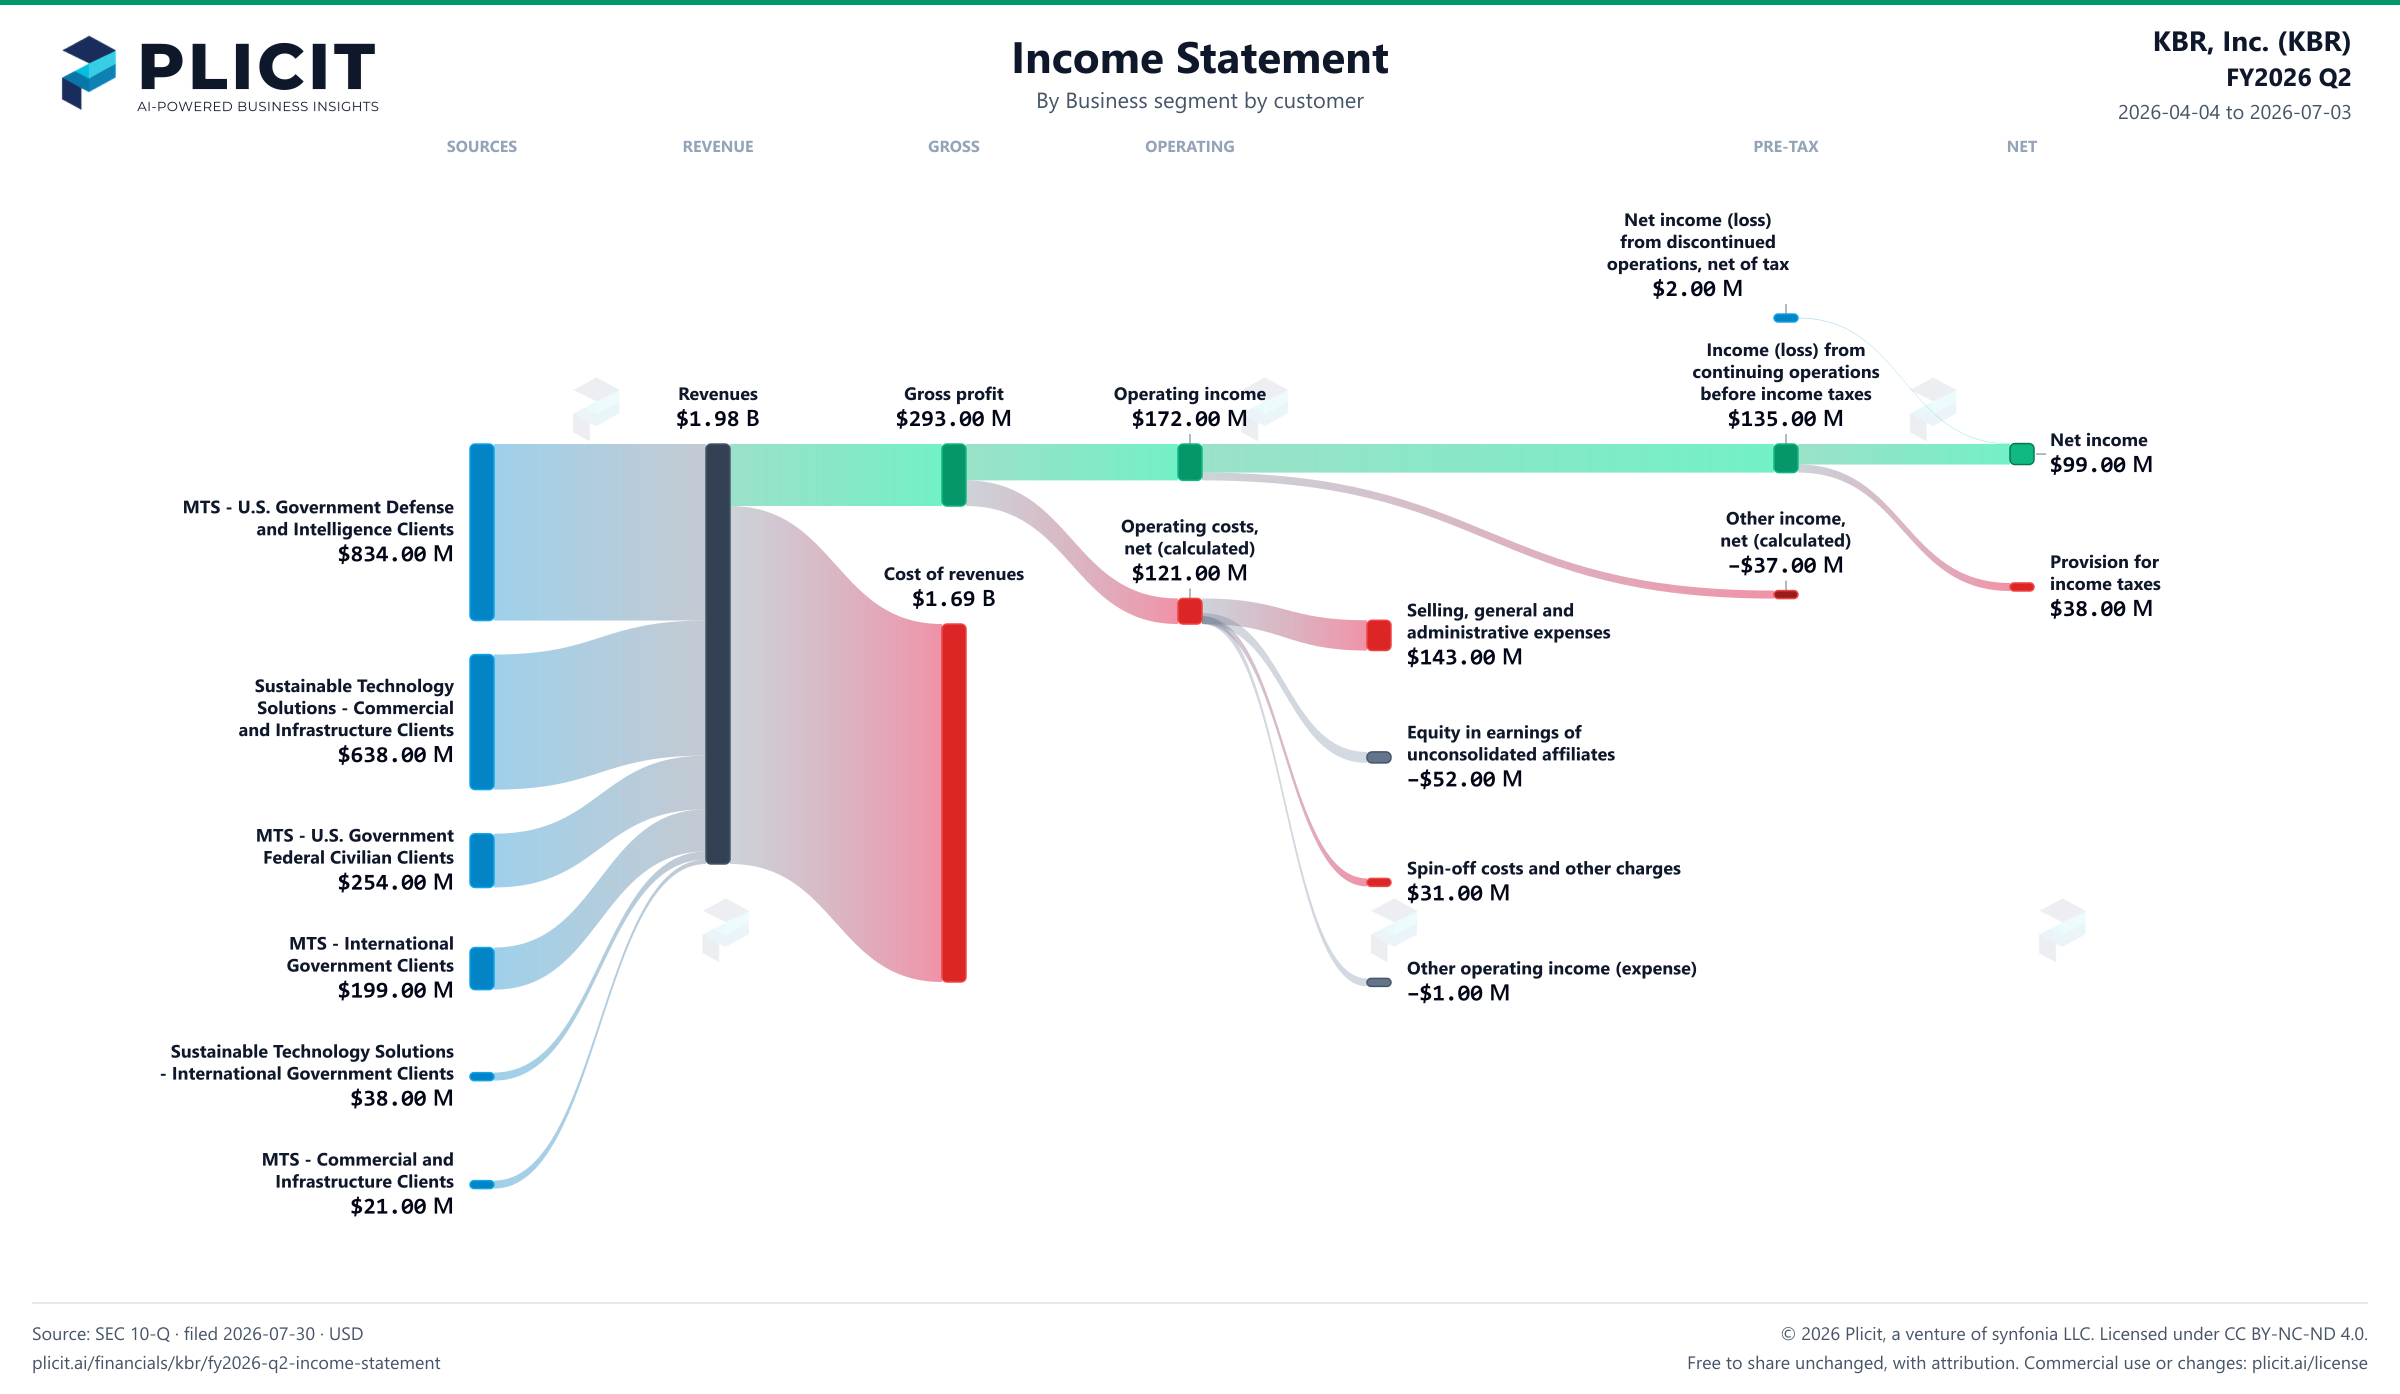
KBR, Inc. (KBR) FY2026 Q2 Revenue by Business Segment by Customer Sankey chart
Free to share unchanged, with credit to Plicit.ai · CC BY-NC-ND 4.0Download PNG

Gross margin

14.8%

Gross profit / revenue

Operating margin

8.7%

Operating profit / revenue

Cash conversion

50.5%

Operating cash / net income, same period

Newsletter

Get the teardowns by email

Subscribe if you want the public-company teardowns in your inbox when they're released.

Product waitlist

Health Check and Teardown for your own company

A health check uncovers insights of your private books, not a public ticker. Join this list to get notified as soon as we go-live!