
CHENIERE ENERGY, INC. (LNG) FY2025 Annual Balance Sheet

Balance Sheet

As of 2025-12-31

Swipe to see the full flow
CHENIERE ENERGY, INC. (LNG) FY2025 Annual Balance SheetBalance sheet as of 2025-12-31. The chart shows assets, liabilities and equity at that date.Current liabilities$3.92 BCurrent assets$3.69 BLiabilities$34.80 BAssets$47.88 BNon-current liabilities$30.89 BNon-current assets$44.19 BEquity$12.94 BRedeemable NCI$136.00 MGross equity(calculated)$21.79 BHOLDINGSASSET CLASSASSETSCLAIM CLASSCLAIM SUB-CLASSCLAIMSTrade and other receivables, net of current expected credit lossesCash and cash equivalentsInventoryRestricted cash and cash equivalentsOther current assets, netMargin depositsCurrent derivative assetsProperty, plant and equipment, net of accumulated depreciationDerivative assetsOperating lease assetsOther non-current assets, netDeferred tax assetsAccrued liabilitiesCurrent derivative liabilitiesCurrent operating lease liabilitiesCurrent debt, net of unamortized discount and debt issuance costsDeferred revenueAccounts payableOther current liabilitiesLong-term debt, net of unamortized discount and debt issuance costsDeferred tax liabilitiesNon-current operating lease liabilitiesOther non-current liabilitiesDerivative liabilitiesRetained earningsAdditional paid-in-capitalCommon stock: $0.003 par value, 480.0 million shares authorized; 279.2 million shares and 278.7 million shares issued at December 31, 2025 and 2024, respectivelyNCICurrent assetsNon-current assetsAssetsCurrent liabilitiesNon-current liabilitiesLiabilitiesEquityGross equity (calculated)Treasury stock: 66.8 million shares and 54.7 million shares at December 31, 2025 and 2024, respectively, at costRedeemable NCIAccrued liabilitiesAccrued liabilities$2.08 BCurrent derivative liabilitiesCurrent derivative liabilities$618.00 MTrade and other receivables, net of current expected credit lossesTrade and other receivables, net$1.38 BCurrent operating lease liabilitiesCurrent operating lease liabilities$539.00 MCurrent liabilitiesCurrent liabilities$3.92 BCash and cash equivalentsCash and cash equivalents$1.10 BCurrent debt, net of unamortized discount and debt issuance costsCurrent debt, net$306.00 MInventoryInventory$524.00 MCurrent assetsCurrent assets$3.69 BDeferred revenueDeferred revenue$150.00 MLiabilitiesLiabilities$34.80 BRestricted cash and cash equivalentsRestricted cash and cash equivalents$485.00 MAccounts payableAccounts payable$123.00 MAssetsAssets$47.88 BOther current assets, netOther current assets, net$119.00 MOther current liabilitiesOther current liabilities$99.00 MMargin depositsMargin deposits$76.00 MNon-current liabilitiesNon-current liabilities$30.89 BCurrent derivative assetsCurrent derivative assets$9.00 MLong-term debt, net of unamortized discount and debt issuance costsLong-term debt, net$22.51 BNon-current assetsNon-current assets$44.19 BDeferred tax liabilitiesDeferred tax liabilities$3.70 BProperty, plant and equipment, net of accumulated depreciationProperty, plant and equipment, net$35.76 BNon-current operating lease liabilitiesNon-current operating lease liabilities$2.16 BEquityEquity$12.94 BOther non-current liabilitiesOther non-current liabilities$1.31 BDerivative liabilitiesDerivative liabilities$1.21 BRedeemable NCIRedeemable NCI$136.00 MGross equity (calculated)Gross equity(calculated)$21.79 BDerivative assetsDerivative assets$4.66 BRetained earningsRetained earnings$12.24 BOperating lease assetsOperating lease assets$2.70 BOther non-current assets, netOther non-current assets, net$1.06 BAdditional paid-in-capitalAdditional paid-in-capital$4.52 BDeferred tax assetsDeferred tax assets$12.00 MCommon stock: $0.003 par value, 480.0 million shares authorized; 279.2 million shares and 278.7 million shares issued at December 31, 2025 and 2024, respectivelyCommon stock: $0.003 par value$1.00 MNCINCI$5.03 BTreasury stock: 66.8 million shares and 54.7 million shares at December 31, 2025 and 2024, respectively, at costTreasury stock: 66.8 million sharesand 54.7 million shares at December 31−$8.85 B
Chart details

CHENIERE ENERGY, INC. (LNG) FY2025 Annual Balance Sheet

Balance sheet as of 2025-12-31. The chart shows assets, liabilities and equity at that date.

Assets
47,882,000,000 US dollars
Current assets
3,692,000,000 US dollars
Non-current assets
44,190,000,000 US dollars
Liabilities
34,804,000,000 US dollars
Current liabilities
3,916,000,000 US dollars
Non-current liabilities
30,888,000,000 US dollars
Equity
12,942,000,000 US dollars
Redeemable NCI
136,000,000 US dollars
Noncontrolling interest
5,027,000,000 US dollars. Included in consolidated equity; this amount is not added again.
Trade and other receivables, net of current expected credit losses
1,380,000,000 US dollars
Cash and cash equivalents
1,099,000,000 US dollars
Inventory
524,000,000 US dollars
Restricted cash and cash equivalents
485,000,000 US dollars
Other current assets, net
119,000,000 US dollars
Margin deposits
76,000,000 US dollars
Current derivative assets
9,000,000 US dollars
Property, plant and equipment, net of accumulated depreciation
35,755,000,000 US dollars
Derivative assets
4,663,000,000 US dollars
Operating lease assets
2,700,000,000 US dollars
Other non-current assets, net
1,060,000,000 US dollars
Deferred tax assets
12,000,000 US dollars
Accrued liabilities
2,081,000,000 US dollars
Current derivative liabilities
618,000,000 US dollars
Current operating lease liabilities
539,000,000 US dollars
Current debt, net of unamortized discount and debt issuance costs
306,000,000 US dollars
Deferred revenue
150,000,000 US dollars
Accounts payable
123,000,000 US dollars
Other current liabilities
99,000,000 US dollars
Long-term debt, net of unamortized discount and debt issuance costs
22,507,000,000 US dollars
Deferred tax liabilities
3,698,000,000 US dollars
Non-current operating lease liabilities
2,163,000,000 US dollars
Other non-current liabilities
1,312,000,000 US dollars
Derivative liabilities
1,208,000,000 US dollars
Retained earnings
12,243,000,000 US dollars
Additional paid-in-capital
4,523,000,000 US dollars
Common stock: $0.003 par value, 480.0 million shares authorized; 279.2 million shares and 278.7 million shares issued at December 31, 2025 and 2024, respectively
1,000,000 US dollars
Preferred stock: $0.0001 par value, 5.0 million shares authorized, none issued
0 US dollars
NCI
5,027,000,000 US dollars
Treasury stock: 66.8 million shares and 54.7 million shares at December 31, 2025 and 2024, respectively, at cost
negative 8,852,000,000 US dollars
Gross equity (calculated)
21,794,000,000 US dollars. Net equity plus the magnitudes of its negative contributions equals gross positive equity. The negative contributions enter this reconciliation as add-backs; their filed signs stay negative.

Chart connections

  • Assets equal liabilities plus temporary equity plus consolidated equity. Consolidated equity includes noncontrolling interests when reported.
  • Treasury shares and other negative equity contributions reduce equity.
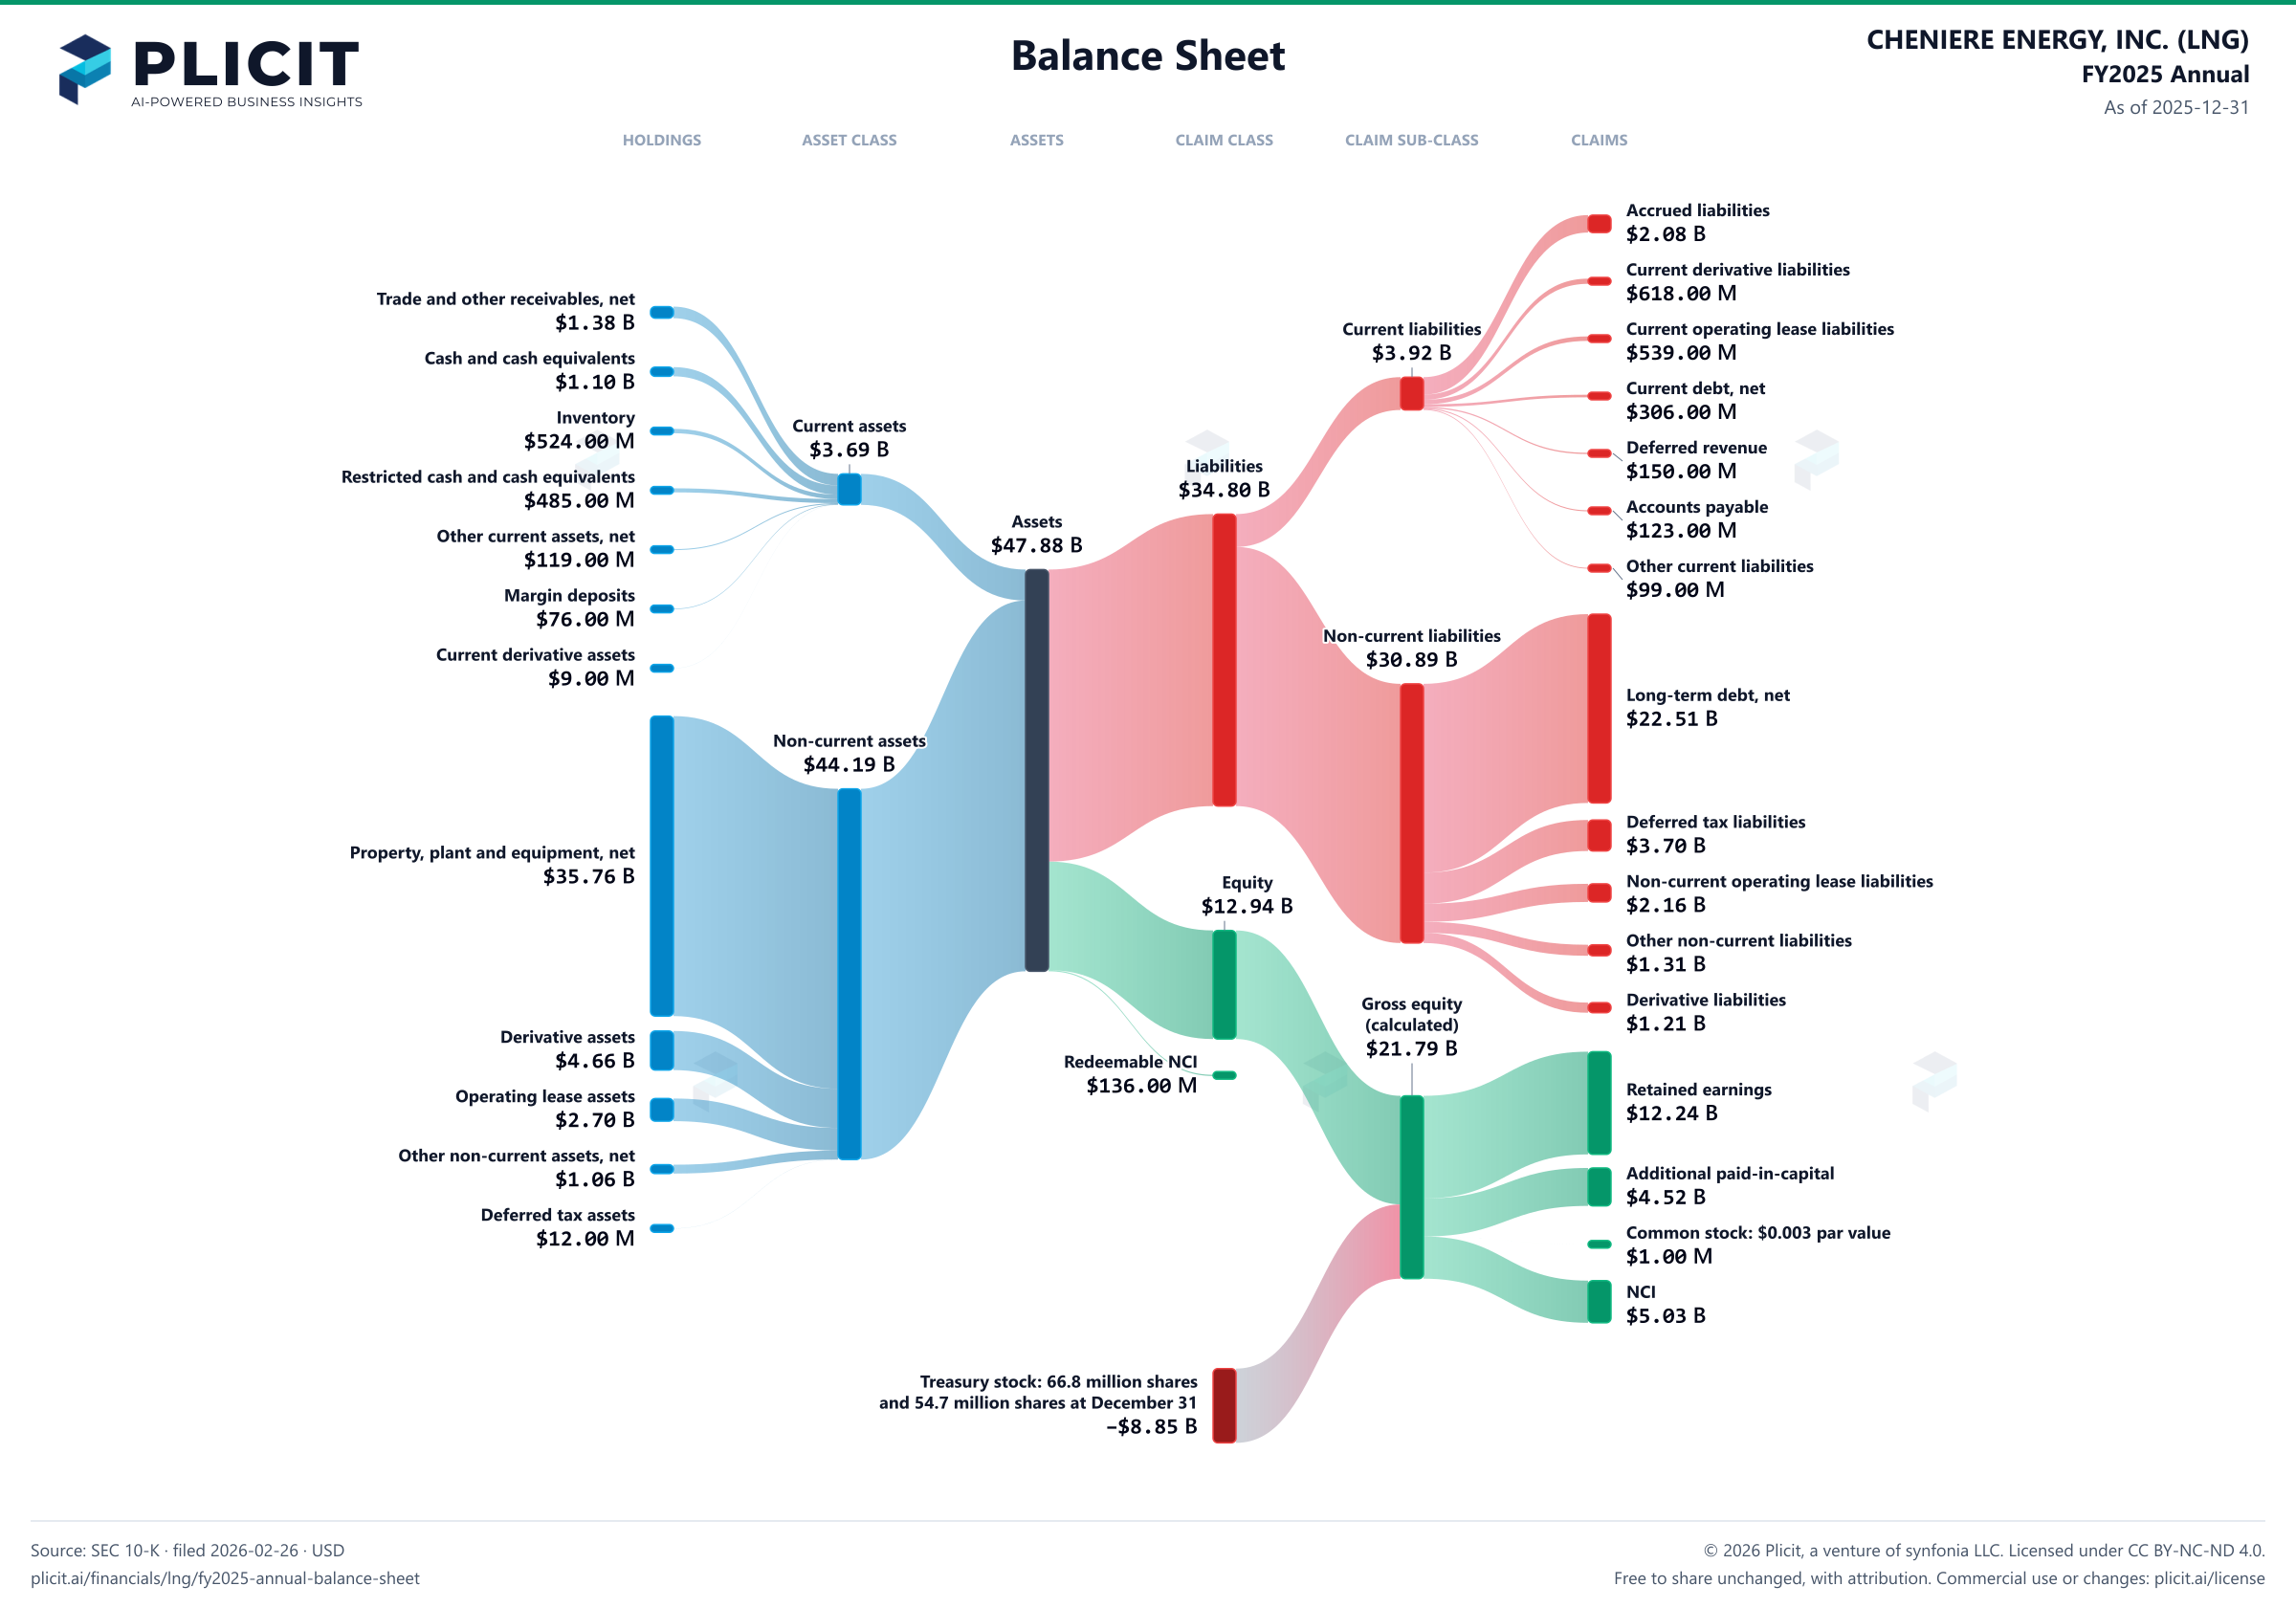
CHENIERE ENERGY, INC. (LNG) FY2025 Annual Balance Sheet Sankey chart
Free to share unchanged, with credit to Plicit.ai · CC BY-NC-ND 4.0Download PNG

Newsletter

Get the teardowns by email

Subscribe if you want the public-company teardowns in your inbox when they're released.

Product waitlist

Health Check and Teardown for your own company

A health check uncovers insights of your private books, not a public ticker. Join this list to get notified as soon as we go-live!