
LIVE NATION ENTERTAINMENT, INC. (LYV) FY2026 Q1 Balance Sheet
As of 2026-03-31
Balance Sheet
As of 2026-03-31
Swipe to see the full flow
Chart details
LIVE NATION ENTERTAINMENT, INC. (LYV) FY2026 Q1 Balance Sheet
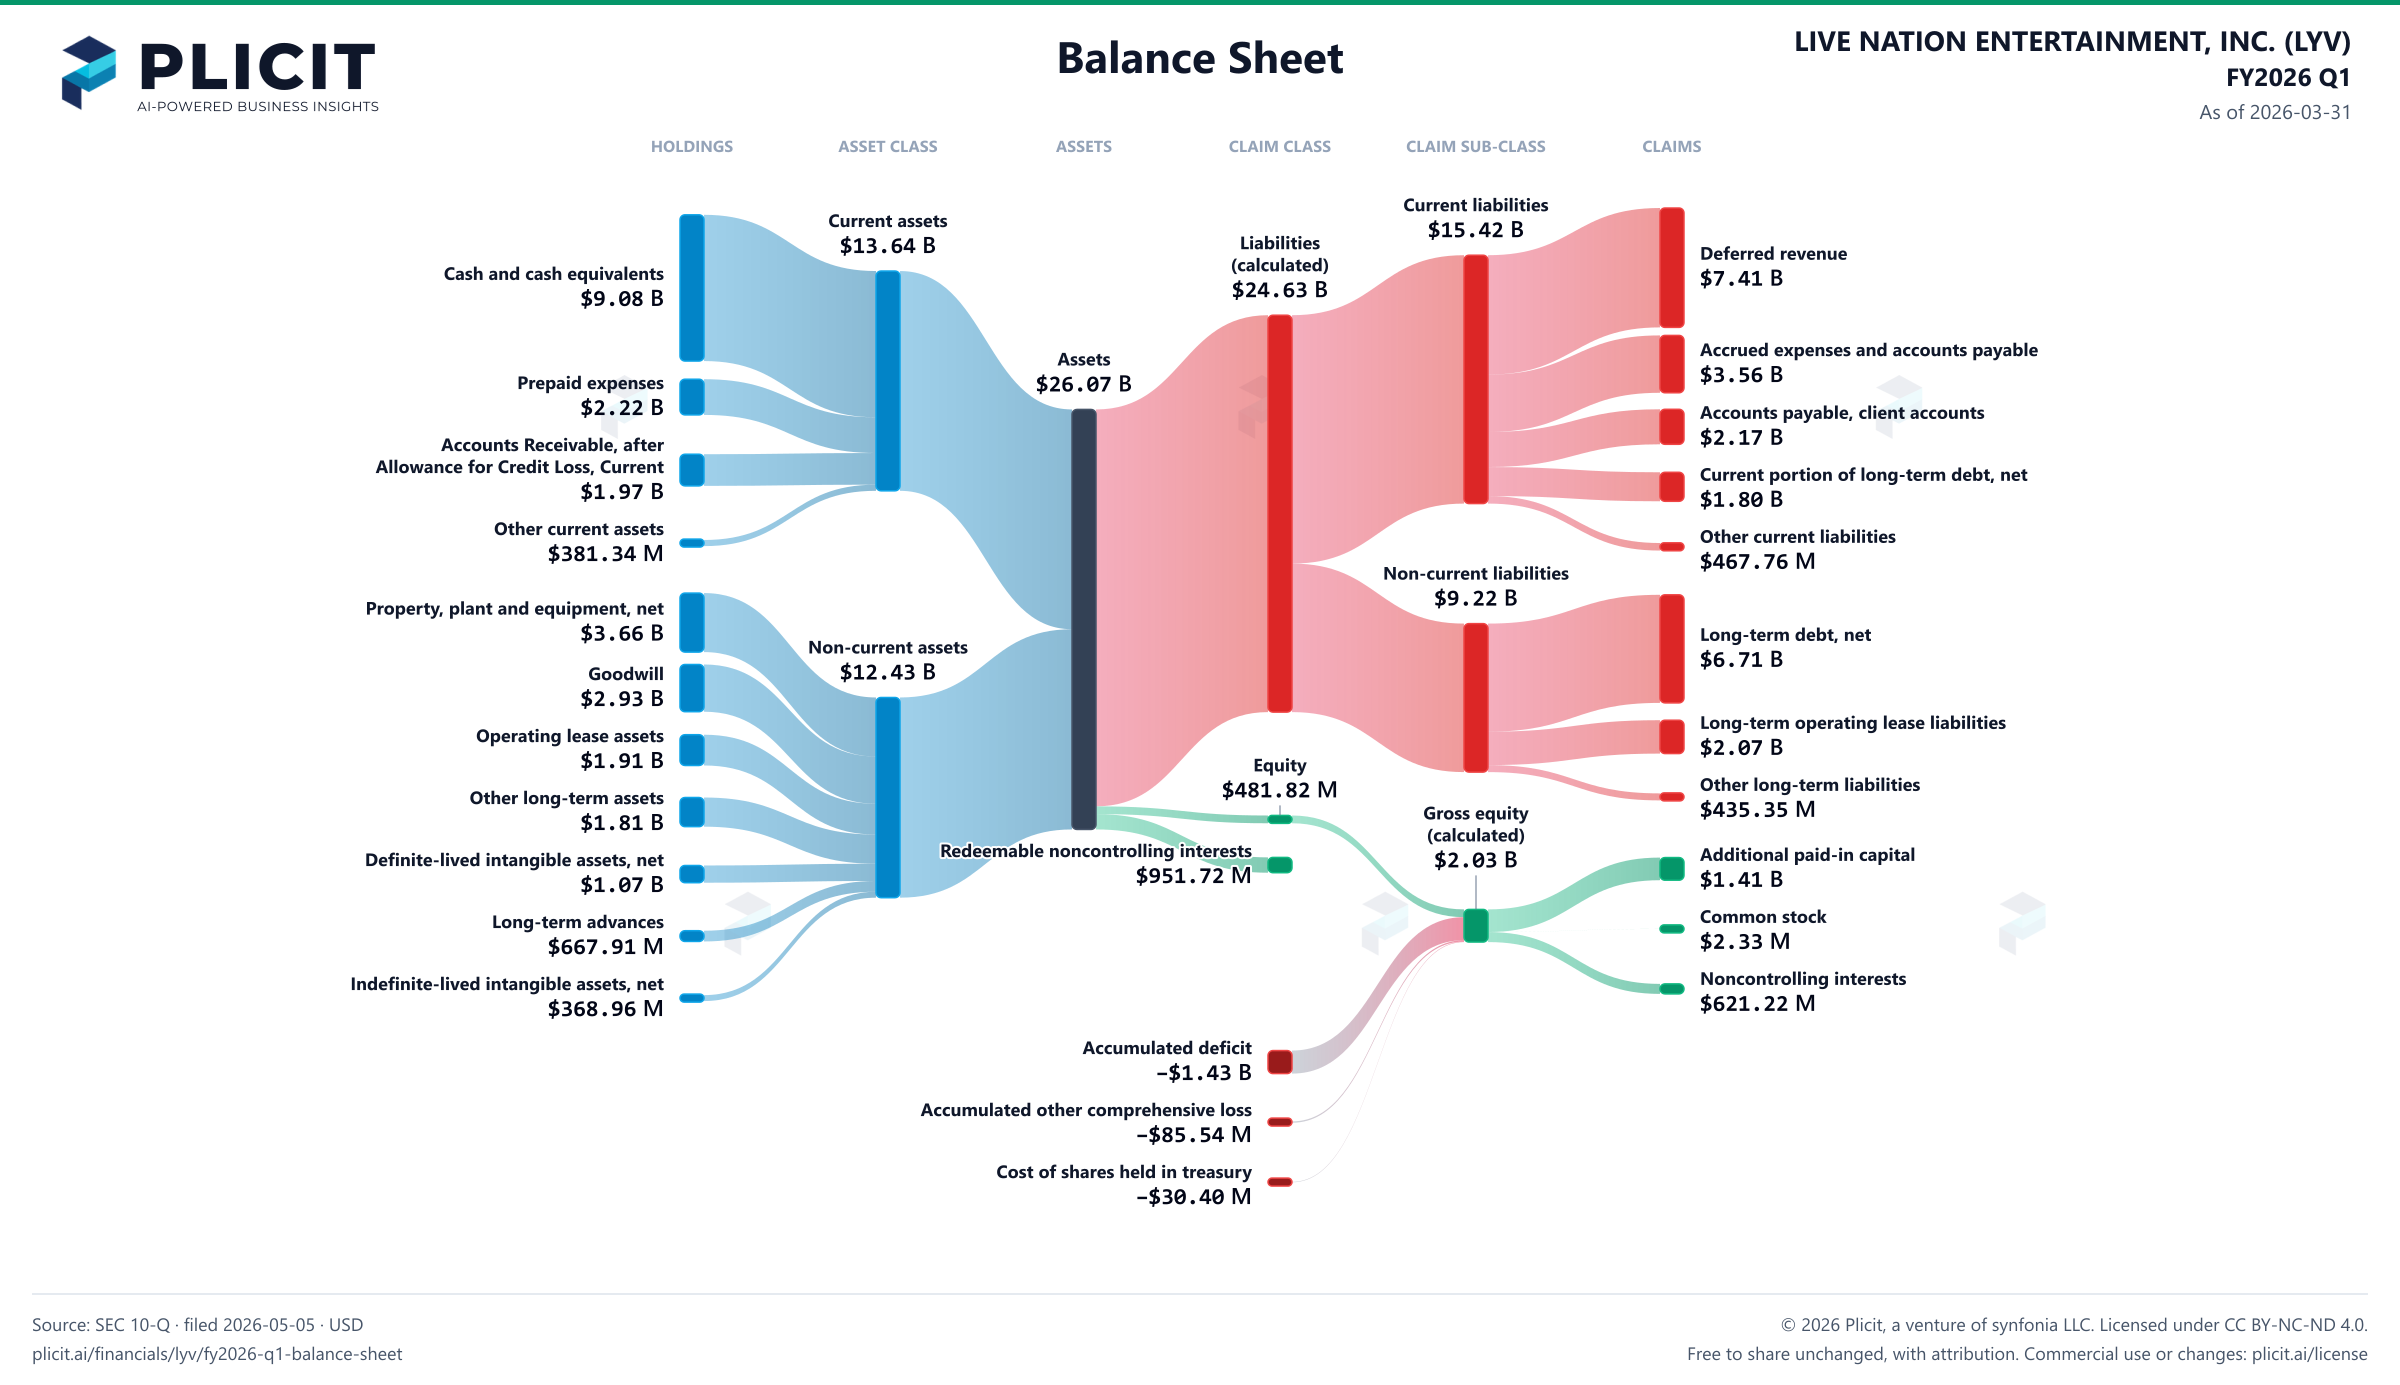
Balance sheet as of 2026-03-31. The chart shows assets, liabilities and equity at that date.
- Assets
- 26,068,092,000 US dollars
- Current assets
- 13,641,539,000 US dollars
- Non-current assets
- 12,426,553,000 US dollars
- Liabilities (calculated)
- 24,634,550,000 US dollars
- Current liabilities
- 15,416,576,000 US dollars
- Non-current liabilities
- 9,217,974,000 US dollars
- Equity
- 481,818,000 US dollars
- Redeemable noncontrolling interests
- 951,724,000 US dollars
- Noncontrolling interest
- 621,222,000 US dollars. Included in consolidated equity; this amount is not added again.
- Accumulated Depreciation, Depletion and Amortization, Property, Plant, and Equipment
- negative 2,123,107,000 US dollars. Part of Property, plant and equipment, net, drawn as one net amount.
- Construction in Progress, Gross
- 880,811,000 US dollars. Part of Property, plant and equipment, net, drawn as one net amount.
- Furniture and Fixtures, Gross
- 1,012,377,000 US dollars. Part of Property, plant and equipment, net, drawn as one net amount.
- Computer equipment and capitalized software
- 836,632,000 US dollars. Part of Property, plant and equipment, net, drawn as one net amount.
- Land, buildings and improvements
- 3,057,518,000 US dollars. Part of Property, plant and equipment, net, drawn as one net amount.
- Cash and cash equivalents
- 9,077,847,000 US dollars
- Prepaid expenses
- 2,217,054,000 US dollars
- Accounts Receivable, after Allowance for Credit Loss, Current
- 1,965,296,000 US dollars
- Other current assets
- 381,342,000 US dollars
- Property, plant and equipment, net
- 3,664,231,000 US dollars
- Goodwill
- 2,933,243,000 US dollars
- Operating lease assets
- 1,910,332,000 US dollars
- Other long-term assets
- 1,810,584,000 US dollars
- Definite-lived intangible assets, net
- 1,071,290,000 US dollars
- Long-term advances
- 667,912,000 US dollars
- Indefinite-lived intangible assets, net
- 368,961,000 US dollars
- Deferred revenue
- 7,410,720,000 US dollars
- Accrued expenses and accounts payable
- 3,562,342,000 US dollars
- Accounts payable, client accounts
- 2,174,981,000 US dollars
- Current portion of long-term debt, net
- 1,800,776,000 US dollars
- Other current liabilities
- 467,757,000 US dollars
- Long-term debt, net
- 6,709,420,000 US dollars
- Long-term operating lease liabilities
- 2,073,207,000 US dollars
- Other long-term liabilities
- 435,347,000 US dollars
- Additional paid-in capital
- 1,405,279,000 US dollars
- Common stock
- 2,333,000 US dollars
- Noncontrolling interests
- 621,222,000 US dollars
- Accumulated deficit
- negative 1,431,082,000 US dollars
- Accumulated other comprehensive loss
- negative 85,538,000 US dollars
- Cost of shares held in treasury
- negative 30,396,000 US dollars
- Gross equity (calculated)
- 2,028,834,000 US dollars. Net equity plus the magnitudes of its negative contributions equals gross positive equity. The negative contributions enter this reconciliation as add-backs; their filed signs stay negative.
Chart connections
- Assets equal liabilities plus temporary equity plus consolidated equity. Consolidated equity includes noncontrolling interests when reported.
- Treasury shares and other negative equity contributions reduce equity.
Free to share unchanged, with credit to Plicit.ai · CC BY-NC-ND 4.0Download PNG
Product waitlist
Health Check and Teardown for your own company
A health check uncovers insights of your private books, not a public ticker. Join this list to get notified as soon as we go-live!