
LIVE NATION ENTERTAINMENT, INC. (LYV) FY2026 Q2 Balance Sheet
As of 2026-06-30
Balance Sheet
As of 2026-06-30
Swipe to see the full flow
Chart details
LIVE NATION ENTERTAINMENT, INC. (LYV) FY2026 Q2 Balance Sheet
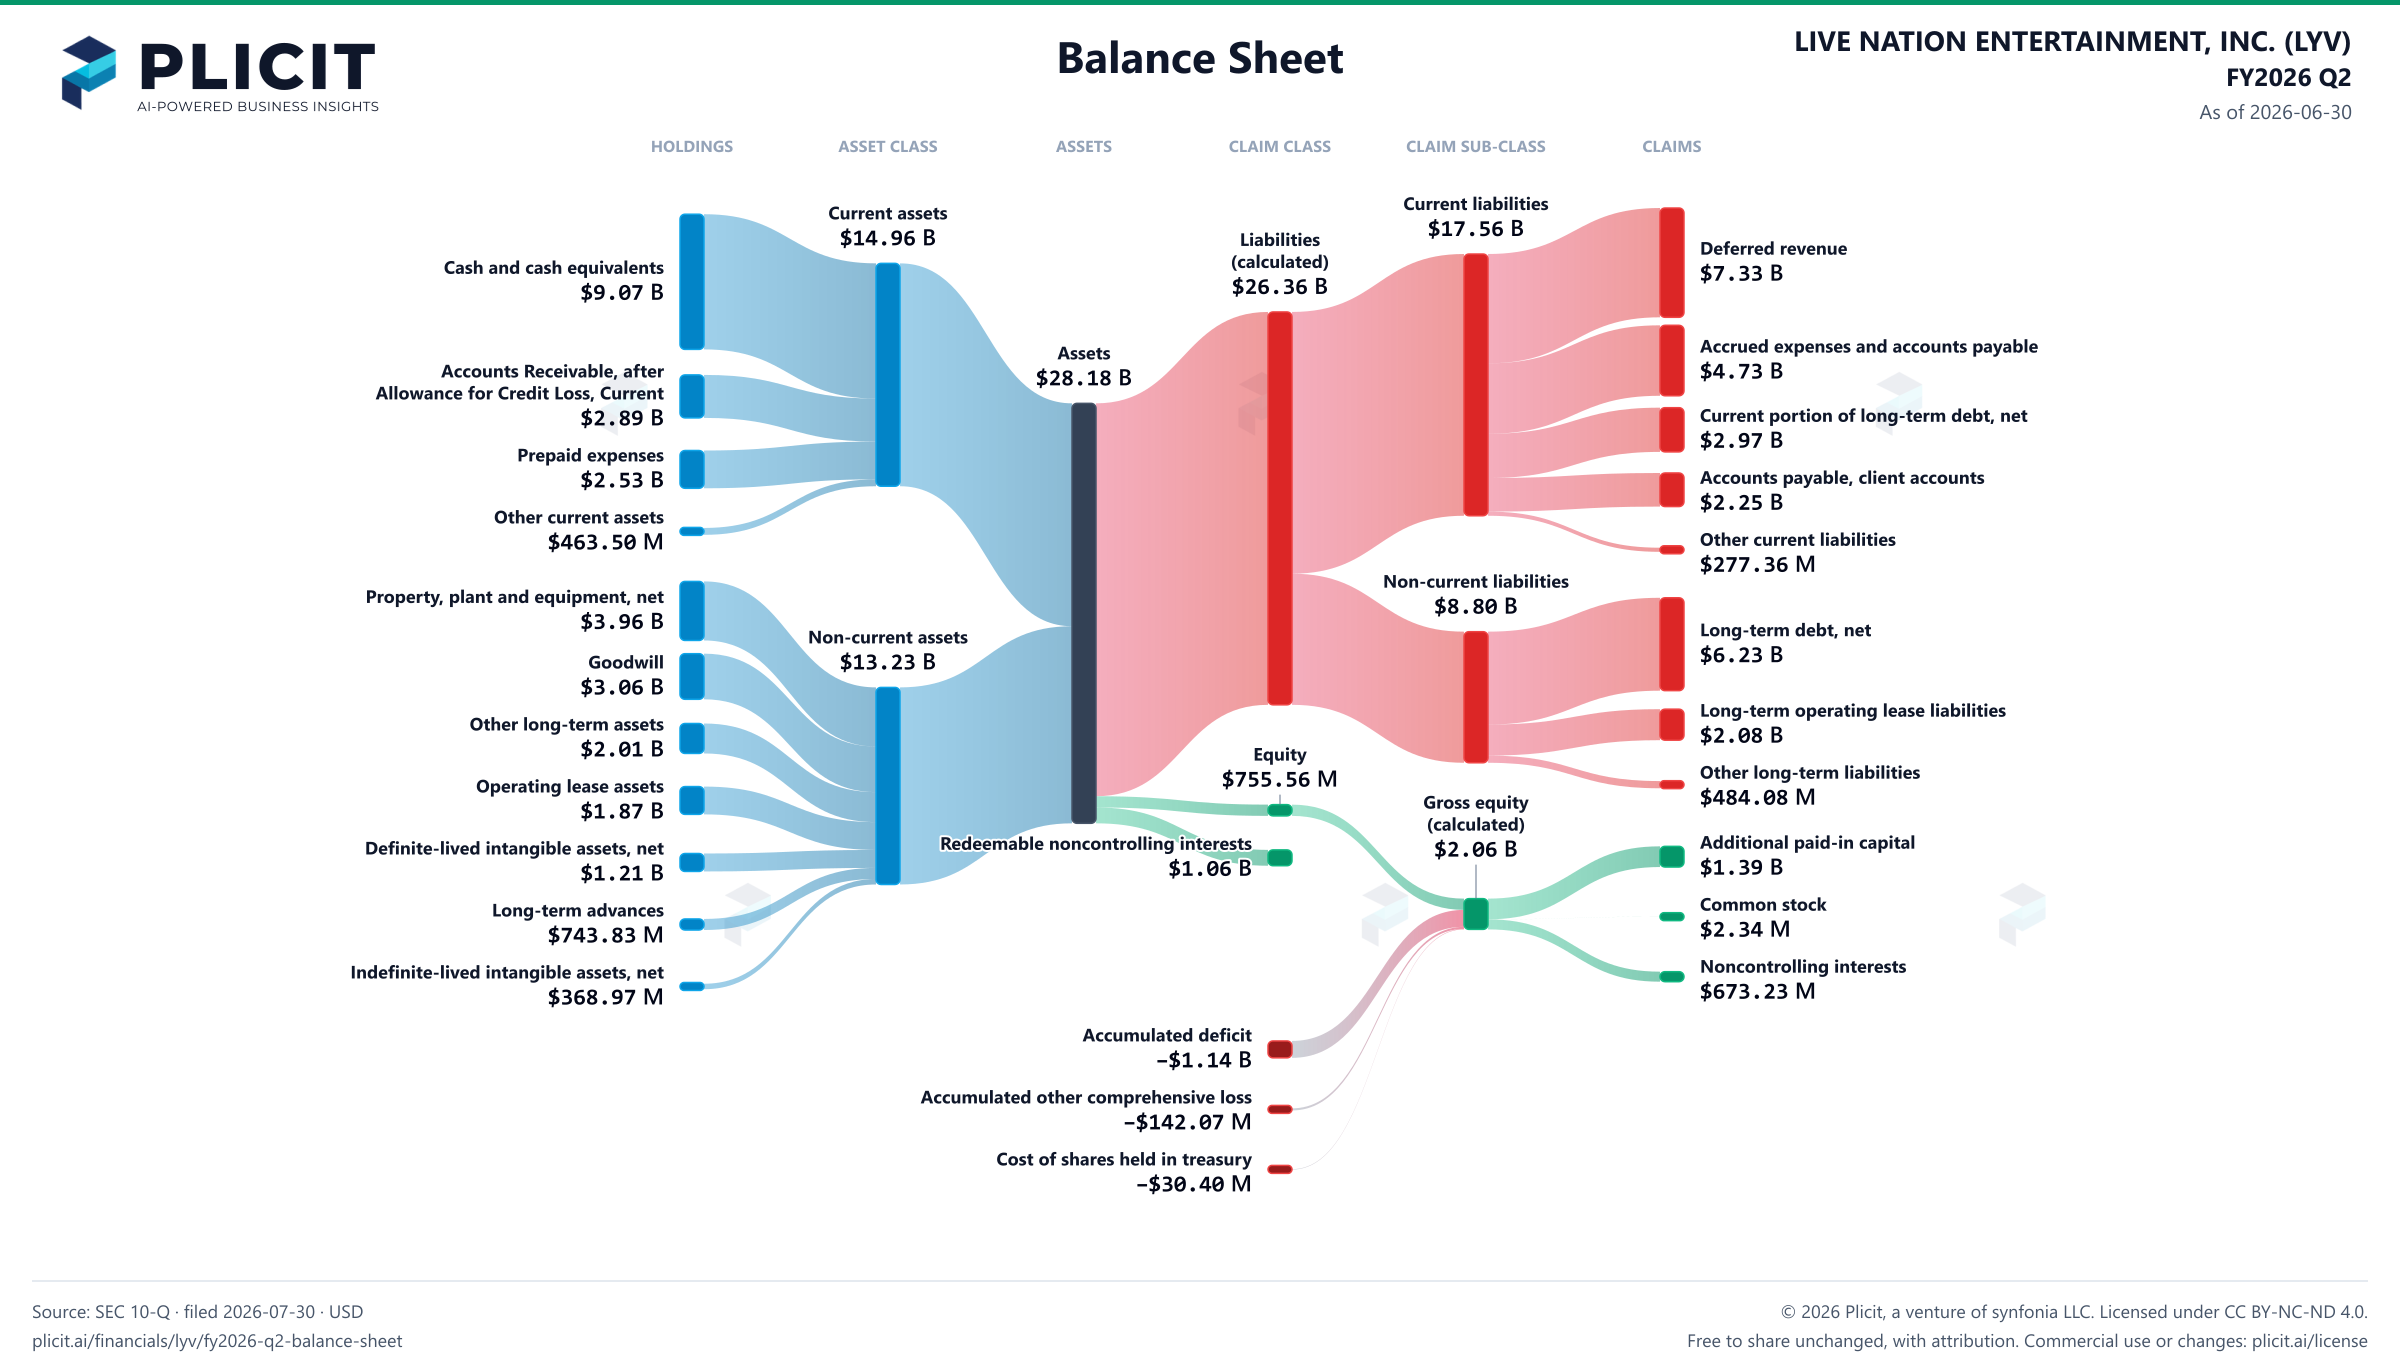
Balance sheet as of 2026-06-30. The chart shows assets, liabilities and equity at that date.
- Assets
- 28,180,826,000 US dollars
- Current assets
- 14,955,649,000 US dollars
- Non-current assets
- 13,225,177,000 US dollars
- Liabilities (calculated)
- 26,361,661,000 US dollars
- Current liabilities
- 17,563,255,000 US dollars
- Non-current liabilities
- 8,798,406,000 US dollars
- Equity
- 755,563,000 US dollars
- Redeemable noncontrolling interests
- 1,063,602,000 US dollars
- Noncontrolling interest
- 673,233,000 US dollars. Included in consolidated equity; this amount is not added again.
- Property, Plant, and Equipment, Accumulated Depreciation, Depletion, and Amortization
- negative 2,192,468,000 US dollars. Part of Property, plant and equipment, net, drawn as one net amount.
- Construction in Progress, Gross
- 844,281,000 US dollars. Part of Property, plant and equipment, net, drawn as one net amount.
- Furniture and Fixtures, Gross
- 1,077,401,000 US dollars. Part of Property, plant and equipment, net, drawn as one net amount.
- Computer equipment and capitalized software
- 846,817,000 US dollars. Part of Property, plant and equipment, net, drawn as one net amount.
- Land, buildings and improvements
- 3,387,962,000 US dollars. Part of Property, plant and equipment, net, drawn as one net amount.
- Cash and cash equivalents
- 9,071,949,000 US dollars
- Accounts Receivable, after Allowance for Credit Loss, Current
- 2,885,249,000 US dollars
- Prepaid expenses
- 2,534,952,000 US dollars
- Other current assets
- 463,499,000 US dollars
- Property, plant and equipment, net
- 3,963,993,000 US dollars
- Goodwill
- 3,063,726,000 US dollars
- Other long-term assets
- 2,011,859,000 US dollars
- Operating lease assets
- 1,866,814,000 US dollars
- Definite-lived intangible assets, net
- 1,205,988,000 US dollars
- Long-term advances
- 743,830,000 US dollars
- Indefinite-lived intangible assets, net
- 368,967,000 US dollars
- Deferred revenue
- 7,334,511,000 US dollars
- Accrued expenses and accounts payable
- 4,728,351,000 US dollars
- Current portion of long-term debt, net
- 2,968,381,000 US dollars
- Accounts payable, client accounts
- 2,254,652,000 US dollars
- Other current liabilities
- 277,360,000 US dollars
- Long-term debt, net
- 6,233,084,000 US dollars
- Long-term operating lease liabilities
- 2,081,247,000 US dollars
- Other long-term liabilities
- 484,075,000 US dollars
- Additional paid-in capital
- 1,389,093,000 US dollars
- Common stock
- 2,335,000 US dollars
- Noncontrolling interests
- 673,233,000 US dollars
- Accumulated deficit
- negative 1,136,636,000 US dollars
- Accumulated other comprehensive loss
- negative 142,066,000 US dollars
- Cost of shares held in treasury
- negative 30,396,000 US dollars
- Gross equity (calculated)
- 2,064,661,000 US dollars. Net equity plus the magnitudes of its negative contributions equals gross positive equity. The negative contributions enter this reconciliation as add-backs; their filed signs stay negative.
Chart connections
- Assets equal liabilities plus temporary equity plus consolidated equity. Consolidated equity includes noncontrolling interests when reported.
- Treasury shares and other negative equity contributions reduce equity.
Free to share unchanged, with credit to Plicit.ai · CC BY-NC-ND 4.0Download PNG
Product waitlist
Health Check and Teardown for your own company
A health check uncovers insights of your private books, not a public ticker. Join this list to get notified as soon as we go-live!