
MANPOWERGROUP INC. (MAN) FY2026 Q2 P&L / Income Statement

Revenue by Business Segment by Timing of Transfer

2026-04-01 to 2026-06-30

Swipe to see the full flow
MANPOWERGROUP INC. (MAN) FY2026 Q2 P&L / Income StatementIncome statement for 2026-04-01 through 2026-06-30. View: Segments by Timing of Transfer of Good or Service. Revenue uses this breakdown; costs and expenses retain the consolidated categories.SOURCESREVENUE RECONCILIATIONREVENUEGROSSOPERATINGPRE-TAXNETNorthern Europe and APME - Services transferred over timeSouthern Europe - Services transferred over timeAmericas - Services transferred over timeNorthern Europe - Services transferred over timeApme - Services transferred over timeNorthern Europe and APME - Services transferred at a point in timeSouthern Europe - Services transferred at a point in timeAmericas - Services transferred at a point in timeNorthern Europe - Services transferred at a point in timeApme - Services transferred at a point in timeRevenues from servicesRevenue before reconciliation (calculated)Components above reported revenue (calculated)Gross profitCost of servicesOperating profit (loss)Operating expenses (calculated)Selling and administrative expensesEarnings (loss) before income taxesOther income (expense), net (calculated)Net earnings (loss)Provision for income taxesRevenue before reconciliation (calculated)Revenue beforereconciliation(calculated)$9.73 BRevenues from servicesRevenuesfrom services$4.86 BEarnings (loss) before income taxesEarnings (loss)before income taxes$92.40 MGross profitGross profit$780.30 MOperating profit (loss)Operating profit (loss)$112.00 MNet earnings (loss)Net earnings (loss)$53.50 MOperating expenses (calculated)Operating expenses(calculated)$668.30 MNorthern Europe and APME - Services transferred over timeNorthern Europe andAPME - Over time$4.78 BCost of servicesCost of services$4.08 BProvision for income taxesProvision forincome taxes$38.90 MSelling and administrative expensesSelling andadministrative expenses$668.30 MOther income (expense), net (calculated)Other income,net (calculated)−$19.60 MSouthern Europe - Services transferred over timeSouthern Europe- Over time$2.27 BAmericas - Services transferred over timeAmericas - Over time$1.19 BNorthern Europe - Services transferred over timeNorthern Europe- Over time$808.30 MComponents above reported revenue (calculated)Components abovereported revenue(calculated)−$4.87 BApme - Services transferred over timeAPME - Over time$507.20 MNorthern Europe and APME - Services transferred at a point in timeNorthern Europeand APME - Ata point in time$88.40 MSouthern Europe - Services transferred at a point in timeSouthern Europe -At a point in time$36.70 MAmericas - Services transferred at a point in timeAmericas - Ata point in time$23.00 MNorthern Europe - Services transferred at a point in timeNorthern Europe -At a point in time$17.20 MApme - Services transferred at a point in timeAPME - At apoint in time$11.50 M
Chart details

MANPOWERGROUP INC. (MAN) FY2026 Q2 P&L / Income Statement

Income statement for 2026-04-01 through 2026-06-30. View: Segments by Timing of Transfer of Good or Service. Revenue uses this breakdown; costs and expenses retain the consolidated categories.

Revenues from services
4,860,200,000 US dollars
Cost of services
4,079,900,000 US dollars
Gross profit
780,300,000 US dollars
Operating expenses (calculated)
668,300,000 US dollars
Operating profit (loss)
112,000,000 US dollars
Other income (expense), net (calculated)
negative 19,600,000 US dollars
Earnings (loss) before income taxes
92,400,000 US dollars
Provision for income taxes
38,900,000 US dollars
Net earnings (loss)
53,500,000 US dollars
Americas - Services transferred at a point in time
23,000,000 US dollars
Americas - Services transferred over time
1,189,300,000 US dollars
Apme - Services transferred at a point in time
11,500,000 US dollars
Apme - Services transferred over time
507,200,000 US dollars
Northern Europe and APME - Services transferred at a point in time
88,400,000 US dollars
Northern Europe and APME - Services transferred over time
4,776,800,000 US dollars
Northern Europe - Services transferred at a point in time
17,200,000 US dollars
Northern Europe - Services transferred over time
808,300,000 US dollars
Southern Europe - Services transferred at a point in time
36,700,000 US dollars
Southern Europe - Services transferred over time
2,272,000,000 US dollars
Selling and administrative expenses
668,300,000 US dollars
Revenue before reconciliation (calculated)
9,730,400,000 US dollars. Sum of the reported revenue categories before the separately reported reconciliation.
Components above reported revenue (calculated)
negative 4,870,200,000 US dollars. The disclosed components add up to more than reported revenue; this is the difference, calculated, not a reported item.

Chart connections

  • Revenue less cost of revenue equals gross profit; gross profit less operating expenses equals operating income.
  • Operating income plus other income or expense equals income before tax. Income before tax less income tax expense or benefit equals net income.
  • Reported revenue categories plus the separately reported signed reconciliation equals consolidated revenue.
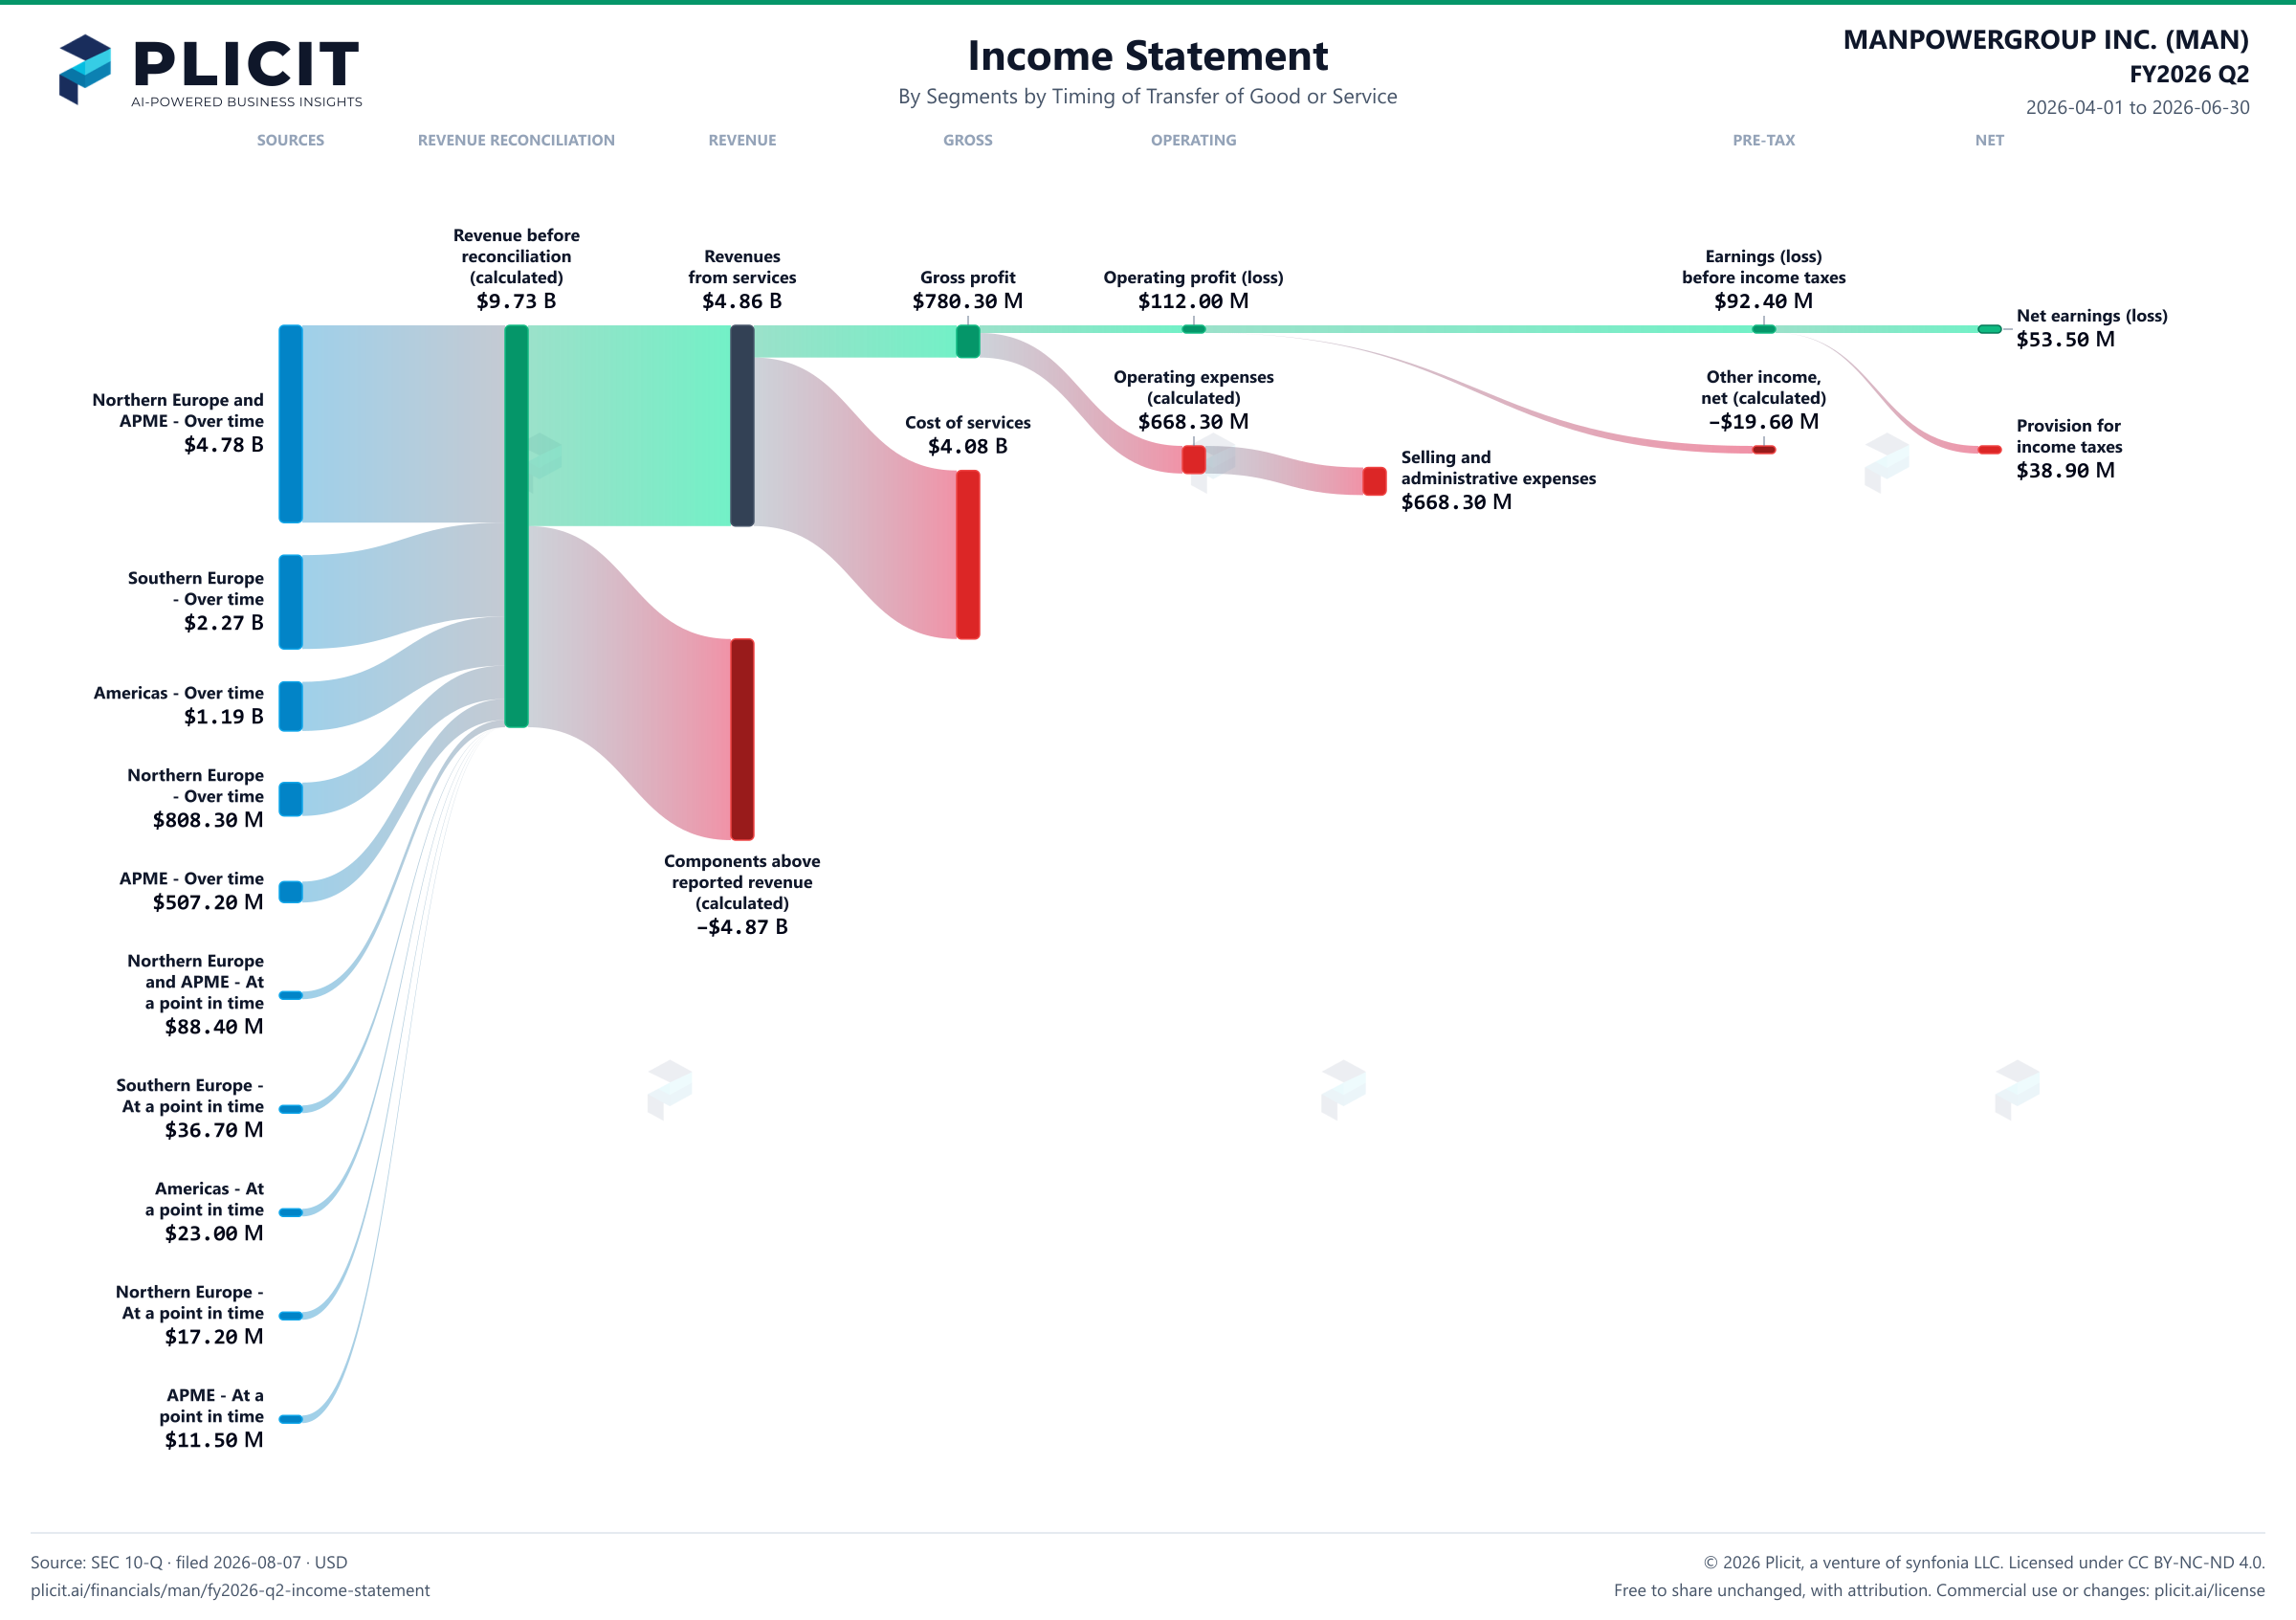
MANPOWERGROUP INC. (MAN) FY2026 Q2 P&L / Income Statement Sankey chart, Segments by Timing of Transfer of Good or Service view
Free to share unchanged, with credit to Plicit.ai · CC BY-NC-ND 4.0Download PNG

Gross margin

16.1%

Gross profit / revenue

Operating margin

2.3%

Operating profit / revenue

Cash conversion

−5.0%

Operating cash / net income, same period

Newsletter

Get the teardowns by email

Subscribe if you want the public-company teardowns in your inbox when they're released.

Product waitlist

Health Check and Teardown for your own company

A health check uncovers insights of your private books, not a public ticker. Join this list to get notified as soon as we go-live!