
Masco Corporation (MAS) FY2026 Q3 Balance Sheet

Published · Updated Source: Form 10-Q on SEC EDGAR filed (opens in a new tab)

Key Takeaways

  • Masco's shareholder deficit reached $448.00 M, up from $185.00 M at the last year-end.
  • Debt rose 10.2% to $3.25 B since year-end, while cash fell to $610.00 M from $647.00 M.
  • Its $610.00 M of cash covers only 37% of the $1.66 B due within a year, a thin cushion.
  • Receivables jumped 22% to $1.25 B since year-end, while nine-month sales rose just two percent.

The Unvarnished Truth

Masco owes more than it owns, and its shareholder deficit grew

Masco owes more than it owns, and the gap is widening. On September 30, 2026, it owed $5.53 B against $5.34 B of assets. The deficit belonging to its own shareholders reached $448.00 M, up from $185.00 M at the last year-end. That is a swing of $263.00 M since year-end. Goodwill and other intangible assets, the premium paid for past deals and assets that cannot be touched, came to $797.00 M, or 15% of its assets. Owners who already sat behind their creditors at the start of the year now sit further behind.

Why did the debt grow? Lenders were owed $3.25 B on September 30, up 10.2% from $2.95 B at the last year-end. The company says the $300 million it borrowed on a term loan went to buying back its shares. Through September 30, buybacks and dividends took $1.04 B, more than the $761.00 M of profit attributable to shareholders. Cash fell as well, from $647.00 M to $610.00 M. The company also says it works with suppliers to extend payment terms. Supplier finance balances grew to $34.00 M from $26.00 M.

Customers are also paying less in advance: they had prepaid $13.00 M on September 30, down 77% from $57.00 M at the last year-end. The term loan that funded part of the buybacks matures on April 21, 2028. The $1.0 billion revolving credit line, unused at quarter end, matures on March 20, 2031. What to watch is whether profit can carry the buybacks without new borrowing. When the debt comes due, will the cash come from profit, from customers paying up front, or from another loan?
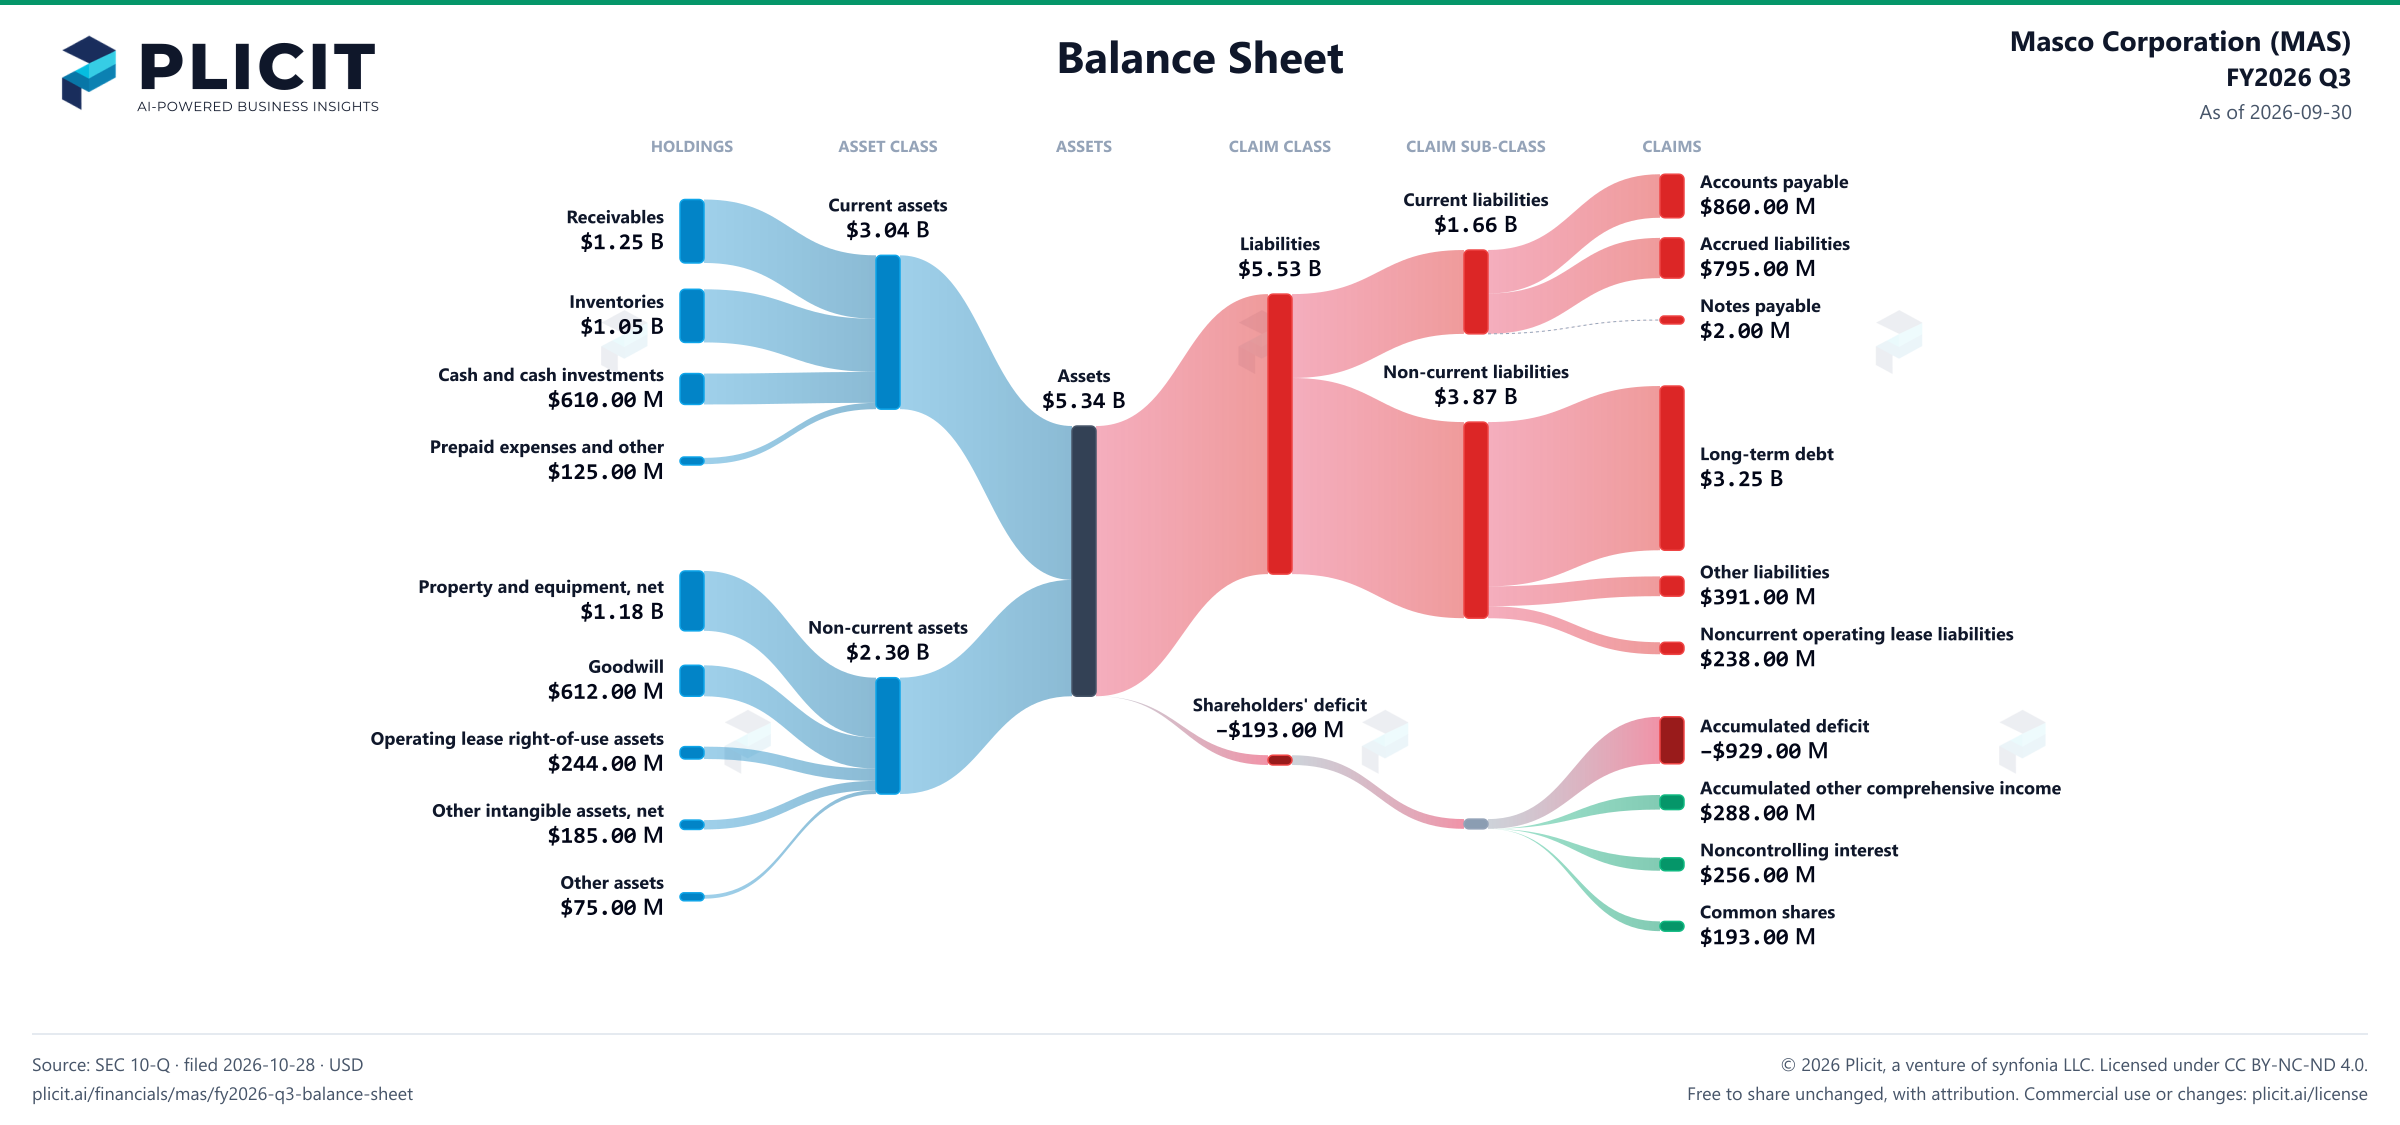
As of 2026-09-30

Balance Sheet

Swipe to see the full flow
Masco Corporation (MAS) FY2026 Q3 Balance SheetBalance sheet as of 2026-09-30. The chart shows assets, liabilities and equity at that date.Current liabilities$1.66 BCurrent assets$3.04 BLiabilities$5.53 BNon-current liabilities$3.87 BAssets$5.34 BNon-current assets$2.30 BShareholders' deficit−$193.00 MHOLDINGSASSET CLASSASSETSCLAIM CLASSCLAIM SUB-CLASSCLAIMSReceivablesInventoriesCash and cash investmentsPrepaid expenses and otherProperty and equipment, netGoodwillOperating lease right-of-use assetsOther intangible assets, netOther assetsAccounts payableAccrued liabilitiesNotes payableLong-term debtOther liabilitiesNoncurrent operating lease liabilitiesRetained deficitAccumulated other comprehensive incomeNoncontrolling interestCommon shares, par value $1 per share Authorized shares: 1,400,000,000; Issued and outstanding: 2026 – 192,800,000; 2025 – 204,300,000Current assetsNon-current assetsAssetsCurrent liabilitiesNon-current liabilitiesLiabilitiesShareholders' deficitShareholders' deficitAccounts payableAccounts payable$860.00 MCurrent liabilitiesCurrent liabilities$1.66 BCurrent assetsCurrent assets$3.04 BReceivablesReceivables$1.25 BAccrued liabilitiesAccrued liabilities$795.00 MLiabilitiesLiabilities$5.53 BInventoriesInventories$1.05 BNotes payableNotes payable$2.00 MNon-current liabilitiesNon-current liabilities$3.87 BCash and cash investmentsCash and cash investments$610.00 MAssetsAssets$5.34 BPrepaid expenses and otherPrepaid expenses and other$125.00 MLong-term debtLong-term debt$3.25 BOther liabilitiesOther liabilities$391.00 MProperty and equipment, netProperty and equipment, net$1.18 BNon-current assetsNon-current assets$2.30 BNoncurrent operating lease liabilitiesNoncurrent operating lease liabilities$238.00 MGoodwillGoodwill$612.00 MShareholders' deficitShareholders' deficit−$193.00 MRetained deficitAccumulated deficit−$929.00 MOperating lease right-of-use assetsOperating lease right-of-use assets$244.00 MAccumulated other comprehensive incomeAccumulated other comprehensive income$288.00 MOther intangible assets, netOther intangible assets, net$185.00 MNoncontrolling interestNoncontrolling interest$256.00 MOther assetsOther assets$75.00 MCommon shares, par value $1 per share Authorized shares: 1,400,000,000; Issued and outstanding: 2026 – 192,800,000; 2025 – 204,300,000Common shares$193.00 M
Chart details

Masco Corporation (MAS) FY2026 Q3 Balance Sheet

Balance sheet as of 2026-09-30. The chart shows assets, liabilities and equity at that date.

Assets
5,338,000,000 US dollars
Current assets
3,039,000,000 US dollars
Non-current assets
2,299,000,000 US dollars
Liabilities
5,531,000,000 US dollars
Current liabilities
1,657,000,000 US dollars
Non-current liabilities
3,874,000,000 US dollars
Shareholders' deficit
negative 193,000,000 US dollars
Noncontrolling interest
256,000,000 US dollars. Included in consolidated equity; this amount is not added again.
Receivables
1,254,000,000 US dollars
Inventories
1,050,000,000 US dollars
Cash and cash investments
610,000,000 US dollars
Prepaid expenses and other
125,000,000 US dollars
Property and equipment, net
1,183,000,000 US dollars
Goodwill
612,000,000 US dollars
Operating lease right-of-use assets
244,000,000 US dollars
Other intangible assets, net
185,000,000 US dollars
Other assets
75,000,000 US dollars
Accounts payable
860,000,000 US dollars
Accrued liabilities
795,000,000 US dollars
Notes payable
2,000,000 US dollars
Long-term debt
3,245,000,000 US dollars
Other liabilities
391,000,000 US dollars
Noncurrent operating lease liabilities
238,000,000 US dollars
Accumulated other comprehensive income
288,000,000 US dollars
Common shares, par value $1 per share Authorized shares: 1,400,000,000; Issued and outstanding: 2026 – 192,800,000; 2025 – 204,300,000
193,000,000 US dollars
Preferred shares authorized: 1,000,000; Issued and outstanding: 2026 and 2025 – None
0 US dollars
Paid-in capital
0 US dollars
Noncontrolling interest
256,000,000 US dollars
Retained deficit
negative 929,000,000 US dollars

Chart connections

  • Assets equal liabilities plus consolidated equity. Consolidated equity includes noncontrolling interests when reported.
  • Treasury shares and other negative equity contributions reduce equity.
  • The filed equity lines add up to −$192.00 M and the equity total is −$193.00 M; the $1.00 M difference is within the rounding of the filed amounts.
Masco Corporation (MAS) FY2026 Q3 Balance Sheet Sankey chart
Free to share unchanged, with credit to Plicit.ai · CC BY-NC-ND 4.0Download PNG

Intelligent Insights for Investors

How much debt does Masco have?

Lenders were owed $3.25 B on September 30, 2026, counting all its debt. If it emptied its bank accounts, it could pay off 19% of that.

Did Masco's shareholders' equity turn negative, or shrink sharply?

It was already negative and fell further: shareholders' equity went from -$185.00 M at the last year-end to -$448.00 M on September 30, 2026. Through September 30, buybacks and dividends came to $1.04 B, more than the $761.00 M profit.

Intelligent Insights for Lenders

Can Masco cover the bills due within a year?

On paper, yes: $3.04 B of current assets, meaning cash plus things that turn into cash within a year, sat against $1.66 B of current liabilities on September 30, 2026. How quickly those assets turn into cash decides the rest.

Intelligent Insights for Suppliers

Does Masco pay its suppliers through a bank finance program?

Yes: Masco owed $34.00 M to suppliers through bank-run payment programs on September 30, 2026, equal to 4.0% of its accounts payable, against $26.00 M at the last year-end. In these programs a bank can pay suppliers early and collect from Masco later. The company says substantially all of its payments are made outside them.

Product waitlist

Health Check and Teardown for your own company

A health check uncovers insights of your private books, not a public ticker. Join this list to get notified as soon as we go-live!