
Masco Corporation (MAS) FY2026 Q3 P&L / Income Statement

Published · Updated Source: Form 10-Q on SEC EDGAR filed (opens in a new tab)

Key Takeaways

  • Profit attributable to shareholders rose 22% to $230.00 M, while pretax profit rose 17%.
  • The tax rate fell to 25.5% from 27.5%, which let profit after tax outrun pretax income.
  • Tariff refunds added about $90 million to operating profit through September 30.
  • Earnings per share rose 30%, outpacing profit at 22% as the share count fell 6%.

The Unvarnished Truth

Masco's profit rose 22%, helped by a lower tax rate

Profit rose 22% this quarter. The tax rate fell to help it. Income before taxes rose only 17%, from $276.00 M to $322.00 M. The tax rate, income tax as a share of pretax profit, dropped to 25.5% from 27.5%. Tariff refunds also inflated the nine-month operating result by about $90 million. The company also booked a $13.00 M gain on the Bristan sale in other income. Strip out those one-time items and the core story is thinner, and the tax line is doing much of the work.

Why did profit rise faster than pretax income? The company says its effective tax rate was lower this quarter. The share count is the other lever: buybacks lowered diluted shares 6%, so each share earned more. Operating profit grew 12%, from $303.00 M to $338.00 M, and that is the number that reflects the business. Selling and overhead costs took a bigger slice of sales: 19.4%, up from 18.4%. Will the profit growth last once the tariff refunds stop?

The business itself grew: sales rose 3% to $1.97 B, and gross margin widened to 36.6%. Yet selling and overhead costs grew faster than sales, eating into the gain. Interest coverage slipped a little: operating profit covered interest 11.7 times, against 12.1 times a year earlier. Profit growth is being helped by a lower tax rate and a one-time gain, so cash is the test. If the tariff refunds and the Bristan gain do not repeat, will the cash show the same profit growth?
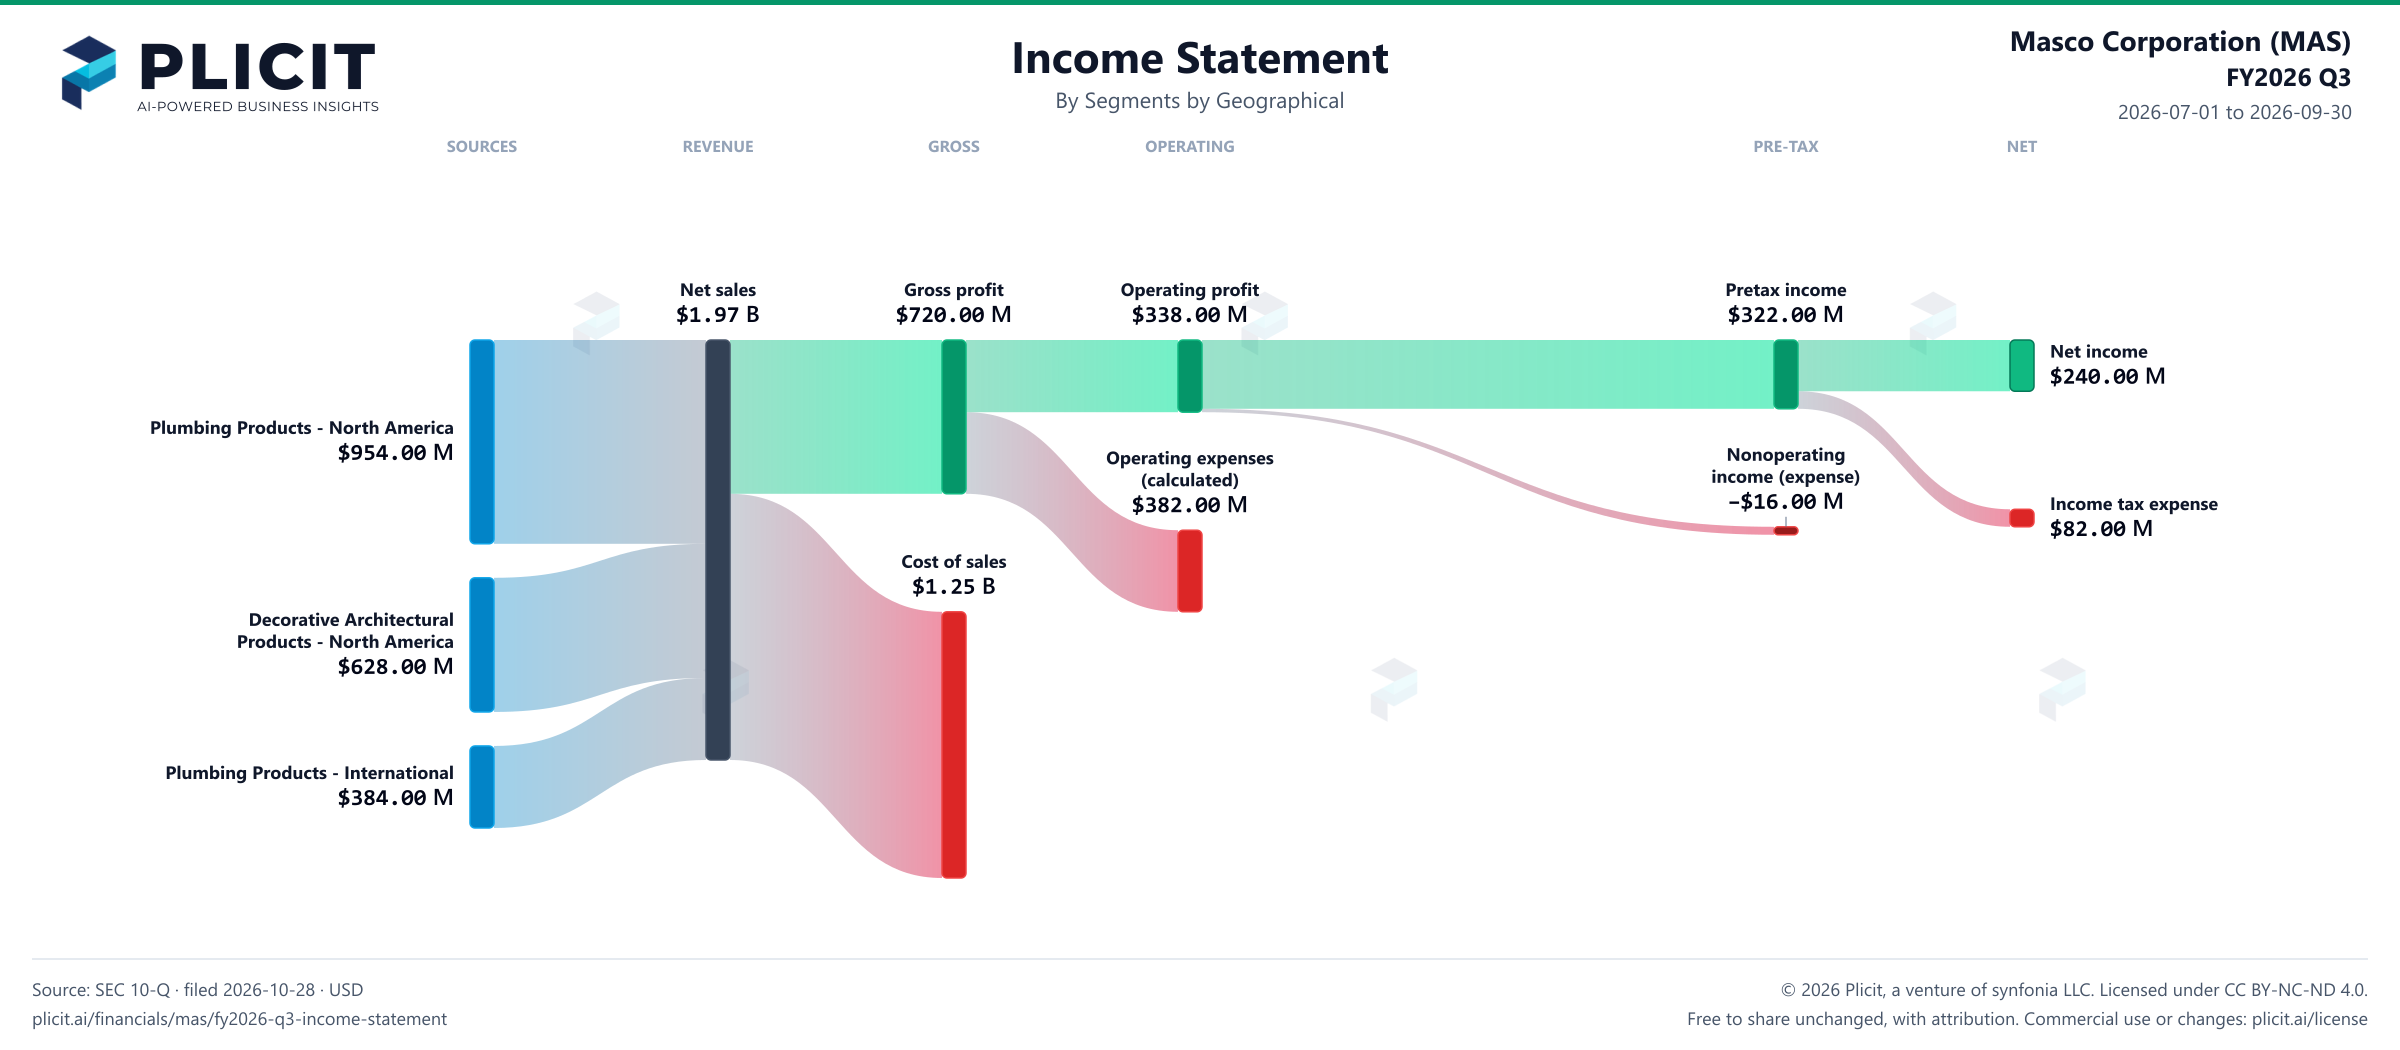
2026-07-01 to 2026-09-30

Revenue by Business Segment by Geography

Swipe to see the full flow
Masco Corporation (MAS) FY2026 Q3 P&L / Income StatementIncome statement for 2026-07-01 through 2026-09-30. View: Segments by Geographical. Revenue uses this breakdown; costs and expenses retain the consolidated categories.SOURCESREVENUEGROSSOPERATINGPRE-TAXNETPlumbing Products - North AmericaDecorative Architectural Products - North AmericaPlumbing Products - InternationalNet salesGross profitCost of salesOperating profitOperating expenses (calculated)Income before income taxesNonoperating income (expense)Net incomeIncome tax expenseNet salesNet sales$1.97 BGross profitGross profit$720.00 MOperating profitOperating profit$338.00 MIncome before income taxesPretax income$322.00 MNet incomeNet income$240.00 MPlumbing Products - North AmericaPlumbing Products - North America$954.00 MOperating expenses (calculated)Operating expenses(calculated)$382.00 MIncome tax expenseIncome tax expense$82.00 MNonoperating income (expense)Nonoperatingincome (expense)−$16.00 MCost of salesCost of sales$1.25 BDecorative Architectural Products - North AmericaDecorative ArchitecturalProducts - North America$628.00 MPlumbing Products - InternationalPlumbing Products - International$384.00 M
Chart details

Masco Corporation (MAS) FY2026 Q3 P&L / Income Statement

Income statement for 2026-07-01 through 2026-09-30. View: Segments by Geographical. Revenue uses this breakdown; costs and expenses retain the consolidated categories.

Net sales
1,966,000,000 US dollars
Cost of sales
1,246,000,000 US dollars
Gross profit
720,000,000 US dollars
Operating expenses (calculated)
382,000,000 US dollars
Operating profit
338,000,000 US dollars
Nonoperating income (expense)
negative 16,000,000 US dollars
Income before income taxes
322,000,000 US dollars
Income tax expense
82,000,000 US dollars
Net income
240,000,000 US dollars
Decorative Architectural Products - North America
628,000,000 US dollars
Decorative Architectural Products - International
0 US dollars
Plumbing Products - North America
954,000,000 US dollars
Plumbing Products - International
384,000,000 US dollars
Selling, general and administrative expenses
381,000,000 US dollars. Source detail retained; this breakdown has not reconciled exactly and is not drawn.

Chart connections

  • Revenue less cost of revenue equals gross profit; gross profit less operating expenses equals operating income.
  • Operating income plus other income or expense equals income before tax. Income before tax less income tax expense or benefit equals net income.
  • Of which attributable to Masco Corporation: $230.00 M; to noncontrolling interests: $10.00 M.
Masco Corporation (MAS) FY2026 Q3 P&L / Income Statement Sankey chart, Segments by Geographical view
Free to share unchanged, with credit to Plicit.ai · CC BY-NC-ND 4.0Download PNG

Intelligent Insights for Investors

Is Masco's profit per share growing faster than its profit?

Yes. Earnings per share rose 30% this quarter, while profit rose 22%. The average number of shares fell 6%.

Did a lower tax rate drive Masco's profit growth?

Some of it. The tax rate fell to 25.5% this quarter from 27.5%, letting profit after tax outrun profit before tax.

Intelligent Insights for Lenders

Does Masco earn enough to cover its interest payments?

Yes. Its operating profit covered its interest 11.7 times this quarter, against 12.1 times a year earlier.

Intelligent Insights for Employees

Is Masco investing more or less in research and equipment than before?

Less, as a share of sales: property and equipment spending came to 2.0% of sales this quarter, against 2.1% a year earlier. Spending fell from $41.00 M to $39.00 M.

Product waitlist

Health Check and Teardown for your own company

A health check uncovers insights of your private books, not a public ticker. Join this list to get notified as soon as we go-live!