
MARKEL GROUP INC. (MKL) FY2026 Q3 P&L / Income Statement

Published · Updated Source: Form 10-Q on SEC EDGAR filed (opens in a new tab)

Key Takeaways

  • Pretax profit fell 65% to $346.75 M as investment gains swung to a loss of $280.91 M.
  • Adjusted operating income, which leaves out those gains, rose 14% to $707.40 M.
  • Operating profit covered interest 7.5 times, down from 19.9 times a year earlier.
  • Revenue rose 6% to $4.16 B, but earned premiums, the core of the insurance business, grew only 3.2%.

The Unvarnished Truth

Stock swings, not operations, drove Markel's profit slump

Markel's pretax profit, the profit before tax, fell 65% this quarter, from $978.44 M to $346.75 M. The income statement shows where the drop came from. Net investment gains went from a gain of $432.89 M a year earlier to a loss of $280.91 M, and the filing says these gains and losses are primarily unrealized moves in its equity portfolio. Management's adjusted operating income, which strips those gains out, rose 14% to $707.40 M. Which number should a shareholder trust?

Why does the stock swing matter so much? Markel holds $13.11 B of equity securities, and the filing says those holdings carry $9.0 B of cumulative pre-tax unrealized gains. Changes in their market value flow straight into reported income, so the reported number can move with the market while the business does not. Management calls that movement distortive and strips it out, which is why its own adjusted figure looks healthier. Both numbers are real, and the reader has to decide which one describes the business.

For a reader, the steady part is interest and dividends. Net investment income rose 5% to $258.12 M, and it is the part of investment results that does not swing with the market. Operating profit covered interest 7.5 times this quarter, against 19.9 times a year earlier, so debt service is thinner. Those are the lines a reader can check in the filing itself. Does the next mark on $13.11 B of stocks decide whether Markel's profit is real, or is the adjusted figure the better guide?
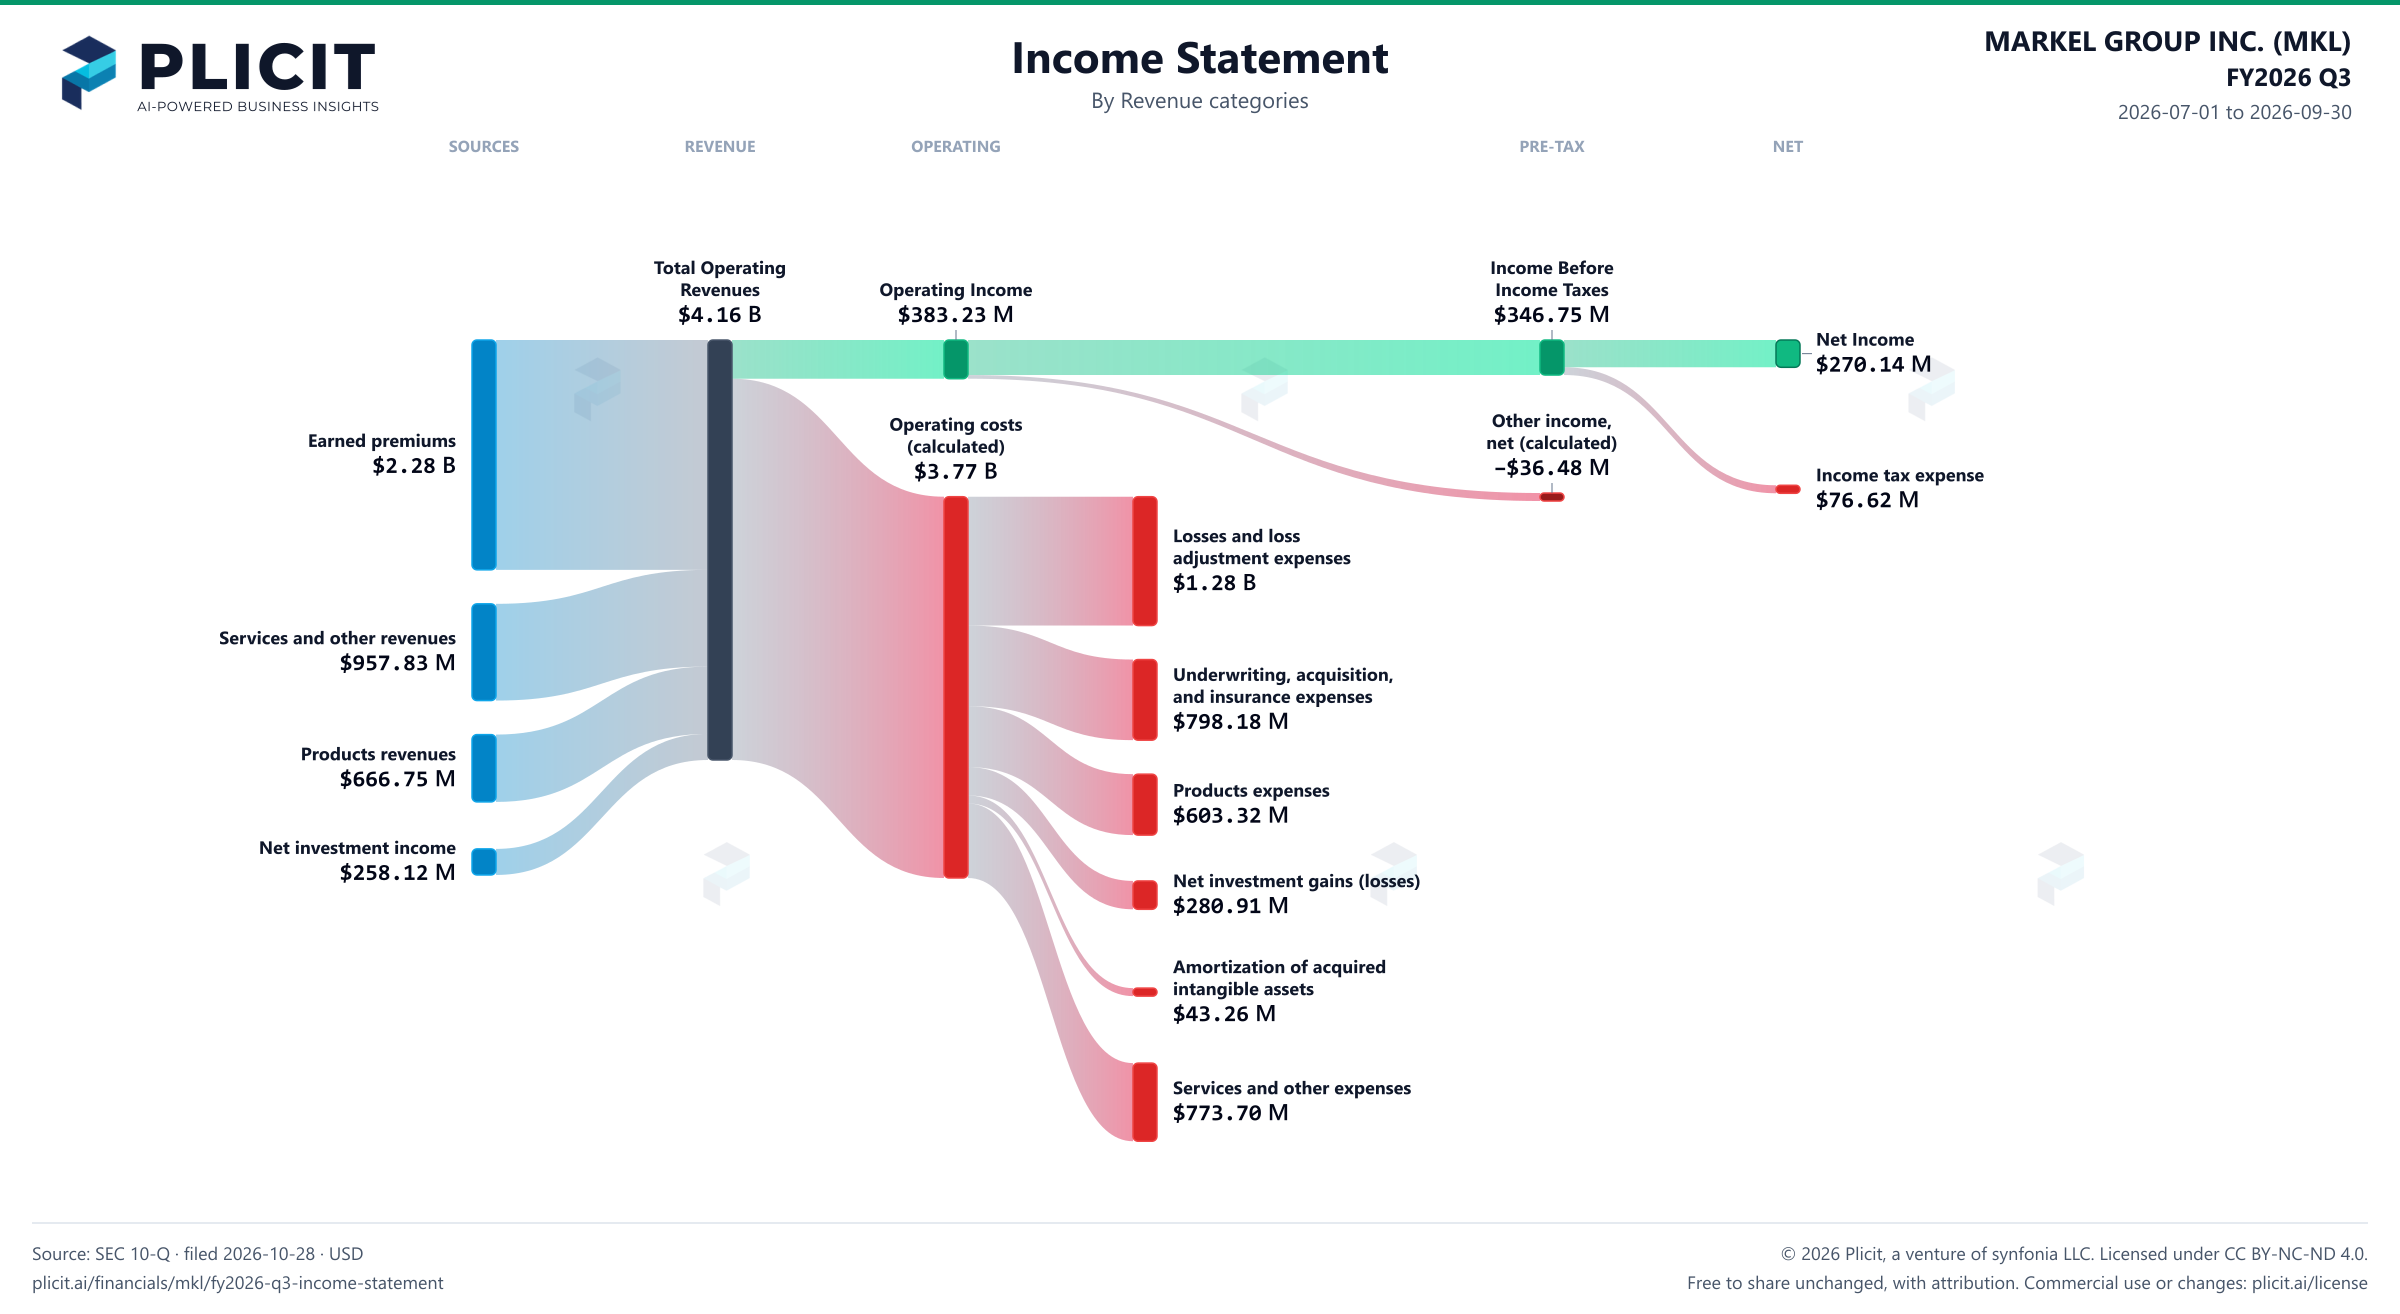
2026-07-01 to 2026-09-30

Revenue by Product and Service

Swipe to see the full flow
MARKEL GROUP INC. (MKL) FY2026 Q3 P&L / Income StatementIncome statement for 2026-07-01 through 2026-09-30. View: Revenue categories. Revenue uses this breakdown; costs and expenses retain the consolidated categories.SOURCESREVENUEOPERATINGPRE-TAXNETEarned premiumsServices and other revenuesProducts revenuesNet investment incomeTotal Operating RevenuesOperating IncomeOperating costs, including other operating expenses (calculated)Losses and loss adjustment expensesUnderwriting, acquisition, and insurance expensesProducts expensesNet investment gains (losses)Amortization of acquired intangible assetsServices and other expensesIncome Before Income TaxesOther income (expense), net (calculated)Net IncomeIncome tax expenseTotal Operating RevenuesTotal OperatingRevenues$4.16 BIncome Before Income TaxesIncome BeforeIncome Taxes$346.75 MOperating IncomeOperating Income$383.23 MNet IncomeNet Income$270.14 MOperating costs, including other operating expenses (calculated)Operating costs(calculated)$3.77 BEarned premiumsEarned premiums$2.28 BIncome tax expenseIncome tax expense$76.62 MOther income (expense), net (calculated)Other income,net (calculated)−$36.48 MLosses and loss adjustment expensesLosses and lossadjustment expenses$1.28 BServices and other revenuesServices and other revenues$957.83 MUnderwriting, acquisition, and insurance expensesUnderwriting, acquisition,and insurance expenses$798.18 MProducts revenuesProducts revenues$666.75 MProducts expensesProducts expenses$603.32 MNet investment incomeNet investment income$258.12 MNet investment gains (losses)Net investment gains (losses)$280.91 MAmortization of acquired intangible assetsAmortization of acquiredintangible assets$43.26 MServices and other expensesServices and other expenses$773.70 M
Chart details

MARKEL GROUP INC. (MKL) FY2026 Q3 P&L / Income Statement

Income statement for 2026-07-01 through 2026-09-30. View: Revenue categories. Revenue uses this breakdown; costs and expenses retain the consolidated categories.

Total Operating Revenues
4,158,203,000 US dollars
Operating costs, including other operating expenses (calculated)
3,774,971,000 US dollars
Operating Income
383,232,000 US dollars
Other income (expense), net (calculated)
negative 36,478,000 US dollars
Income Before Income Taxes
346,754,000 US dollars
Income tax expense
76,617,000 US dollars
Net Income
270,137,000 US dollars
Earned premiums
2,275,508,000 US dollars
Net investment income
258,115,000 US dollars
Products revenues
666,749,000 US dollars
Services and other revenues
957,831,000 US dollars
Losses and loss adjustment expenses
1,275,605,000 US dollars
Underwriting, acquisition, and insurance expenses
798,179,000 US dollars
Products expenses
603,322,000 US dollars
Services and other expenses
773,700,000 US dollars
Amortization of acquired intangible assets
43,256,000 US dollars
Net investment gains (losses)
280,909,000 US dollars

Chart connections

  • Revenue minus operating expenses equals operating income.
  • Operating income plus other income or expense equals income before tax. Income before tax less income tax expense or benefit equals net income.
  • Of which attributable to MARKEL GROUP INC.: $259.26 M; to noncontrolling interests: $10.88 M.
MARKEL GROUP INC. (MKL) FY2026 Q3 P&L / Income Statement Sankey chart
Free to share unchanged, with credit to Plicit.ai · CC BY-NC-ND 4.0Download PNG

Intelligent Insights for Investors

Did Markel make a profit this period?

It did. On $4.16 B of sales this quarter, $270.14 M was left as profit once every cost, interest charge and tax was counted.

Does Markel make its money from insurance or from investing premiums?

Investment income, the interest and dividends its portfolio earns, made up 74% of pretax profit this quarter, against 25% a year earlier. Underwriting, fees and other items made up the rest.

What gains or losses changed Markel's equity outside net income?

Gains and losses outside net income took away $415.59 M this quarter, mostly from changes in the value of debt securities. Comprehensive income came to -$156.33 M, against net income of $259.26 M.

Intelligent Insights for Lenders

Does Markel earn enough to cover its interest payments?

Yes: its operating profit covered its interest 7.5 times this quarter, against 19.9 times a year earlier. Interest took 13% of operating profit this quarter, against 5% a year earlier.

Intelligent Insights for Customers

How does Markel make its money?

Mostly from earned premiums: 55% of its $4.16 B of revenue this quarter, ahead of services and other revenues at 23%. Earned premiums are the payments customers make for insurance coverage.

Product waitlist

Health Check and Teardown for your own company

A health check uncovers insights of your private books, not a public ticker. Join this list to get notified as soon as we go-live!