
MONSTER BEVERAGE CORPORATION (MNST) FY2024 Annual P&L / Income Statement

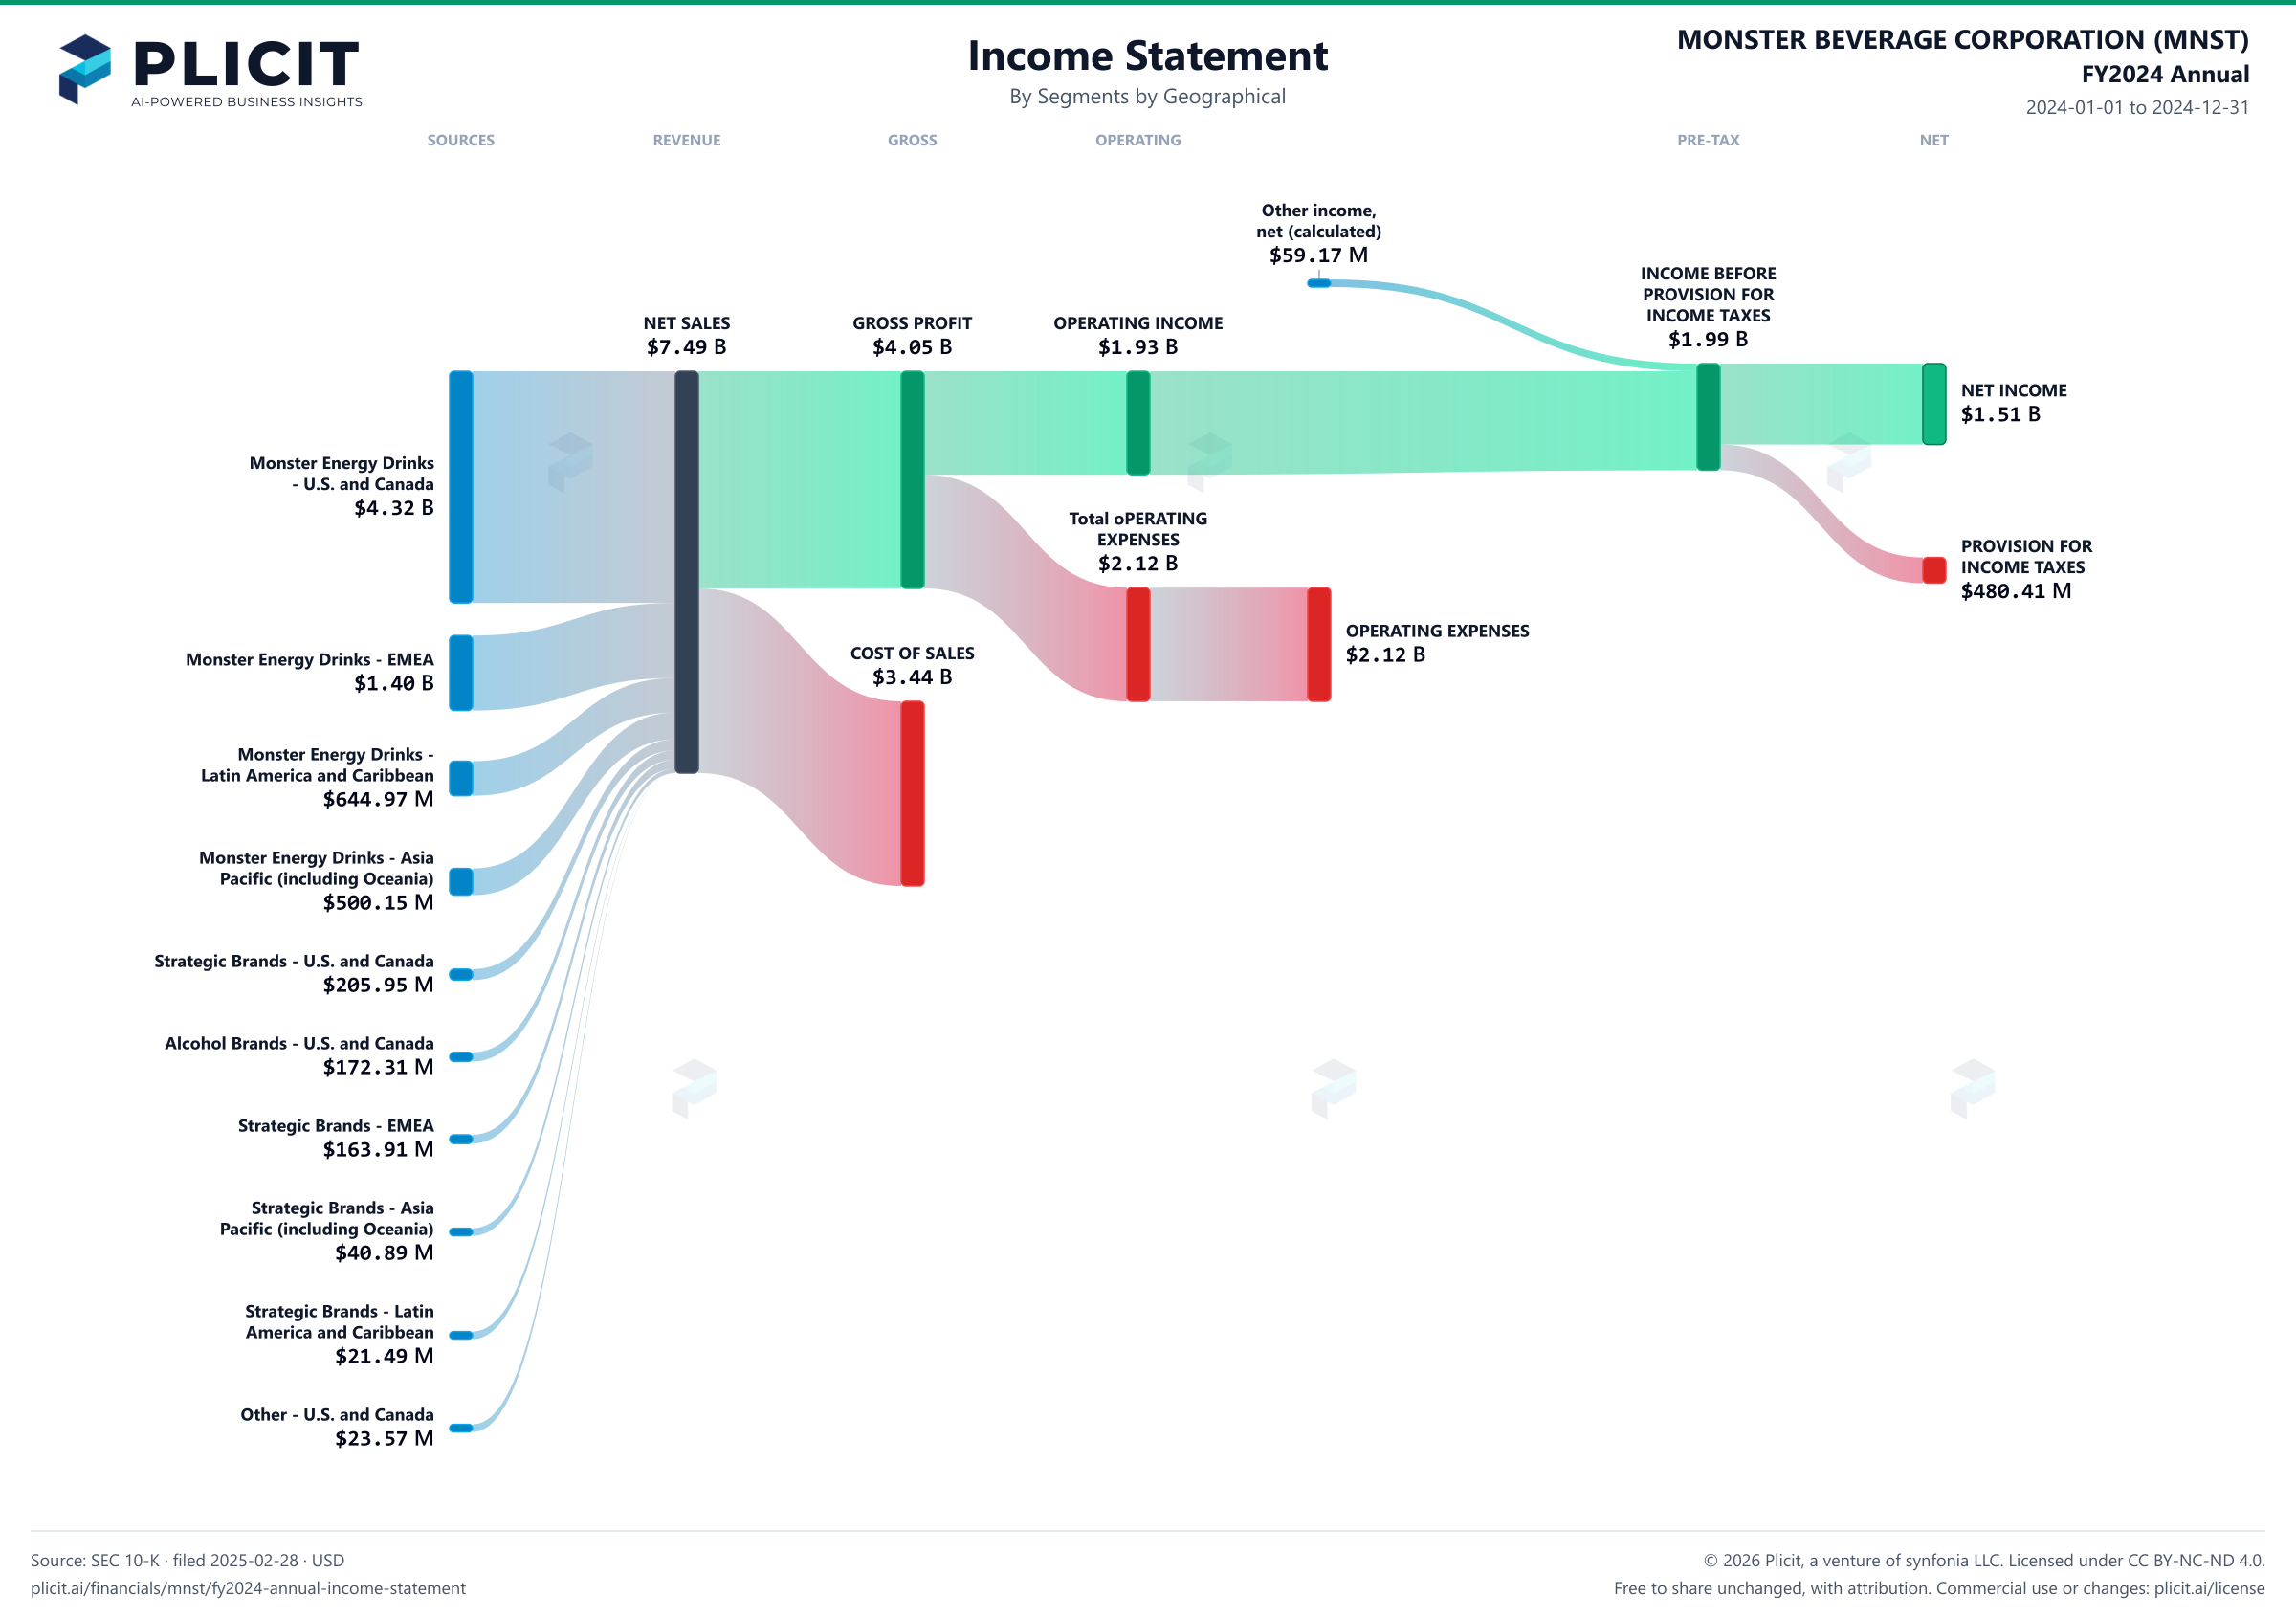
Revenue by Business Segment by Geography

2024-01-01 to 2024-12-31

Swipe to see the full flow
MONSTER BEVERAGE CORPORATION (MNST) FY2024 Annual P&L / Income StatementIncome statement for 2024-01-01 through 2024-12-31. View: Segments by Geographical. Revenue uses this breakdown; costs and expenses retain the consolidated categories.SOURCESREVENUEGROSSOPERATINGPRE-TAXNETMonster Energy Drinks - U.S. and CanadaMonster Energy Drinks - EMEAMonster Energy Drinks - Latin America and CaribbeanMonster Energy Drinks - Asia Pacific (including Oceania)Strategic Brands - U.S. and CanadaAlcohol Brands - U.S. and CanadaStrategic Brands - EMEAStrategic Brands - Asia Pacific (including Oceania)Strategic Brands - Latin America and CaribbeanOther - U.S. and CanadaNET SALESGROSS PROFITCOST OF SALESOPERATING INCOMETotal oPERATING EXPENSESOPERATING EXPENSESOther income (expense), net (calculated)INCOME BEFORE PROVISION FOR INCOME TAXESNET INCOMEPROVISION FOR INCOME TAXESOther income (expense), net (calculated)Other income,net (calculated)$59.17 MINCOME BEFORE PROVISION FOR INCOME TAXESINCOME BEFOREPROVISION FORINCOME TAXES$1.99 BNET SALESNET SALES$7.49 BGROSS PROFITGROSS PROFIT$4.05 BOPERATING INCOMEOPERATING INCOME$1.93 BNET INCOMENET INCOME$1.51 BMonster Energy Drinks - U.S. and CanadaMonster Energy Drinks- U.S. and Canada$4.32 BTotal oPERATING EXPENSESTotal oPERATINGEXPENSES$2.12 BPROVISION FOR INCOME TAXESPROVISION FORINCOME TAXES$480.41 MOPERATING EXPENSESOPERATING EXPENSES$2.12 BCOST OF SALESCOST OF SALES$3.44 BMonster Energy Drinks - EMEAMonster Energy Drinks - EMEA$1.40 BMonster Energy Drinks - Latin America and CaribbeanMonster Energy Drinks -Latin America and Caribbean$644.97 MMonster Energy Drinks - Asia Pacific (including Oceania)Monster Energy Drinks - AsiaPacific (including Oceania)$500.15 MStrategic Brands - U.S. and CanadaStrategic Brands - U.S. and Canada$205.95 MAlcohol Brands - U.S. and CanadaAlcohol Brands - U.S. and Canada$172.31 MStrategic Brands - EMEAStrategic Brands - EMEA$163.91 MStrategic Brands - Asia Pacific (including Oceania)Strategic Brands - AsiaPacific (including Oceania)$40.89 MStrategic Brands - Latin America and CaribbeanStrategic Brands - LatinAmerica and Caribbean$21.49 MOther - U.S. and CanadaOther - U.S. and Canada$23.57 M
Chart details

MONSTER BEVERAGE CORPORATION (MNST) FY2024 Annual P&L / Income Statement

Income statement for 2024-01-01 through 2024-12-31. View: Segments by Geographical. Revenue uses this breakdown; costs and expenses retain the consolidated categories.

NET SALES
7,492,709,000 US dollars
COST OF SALES
3,443,831,000 US dollars
GROSS PROFIT
4,048,878,000 US dollars
Total oPERATING EXPENSES
2,118,584,000 US dollars
OPERATING INCOME
1,930,294,000 US dollars
Other income (expense), net (calculated)
59,165,000 US dollars
INCOME BEFORE PROVISION FOR INCOME TAXES
1,989,459,000 US dollars
PROVISION FOR INCOME TAXES
480,411,000 US dollars
NET INCOME
1,509,048,000 US dollars
Alcohol Brands - U.S. and Canada
172,313,000 US dollars
Monster Energy Drinks - Latin America and Caribbean
644,965,000 US dollars
Monster Energy Drinks - U.S. and Canada
4,320,026,000 US dollars
Monster Energy Drinks - Asia Pacific (including Oceania)
500,145,000 US dollars
Monster Energy Drinks - EMEA
1,399,461,000 US dollars
Strategic Brands - Latin America and Caribbean
21,489,000 US dollars
Strategic Brands - U.S. and Canada
205,948,000 US dollars
Strategic Brands - Asia Pacific (including Oceania)
40,891,000 US dollars
Strategic Brands - EMEA
163,905,000 US dollars
Other - U.S. and Canada
23,566,000 US dollars
OPERATING EXPENSES
2,118,584,000 US dollars

Chart connections

  • Revenue less cost of revenue equals gross profit; gross profit less operating expenses equals operating income.
  • Operating income plus other income or expense equals income before tax. Income before tax less income tax expense or benefit equals net income.
MONSTER BEVERAGE CORPORATION (MNST) FY2024 Annual P&L / Income Statement Sankey chart, Segments by Geographical view
Free to share unchanged, with credit to Plicit.ai · CC BY-NC-ND 4.0Download PNG

Gross margin

54.0%

Gross profit / revenue

Operating margin

25.8%

Operating profit / revenue

Cash conversion

127.8%

Operating cash / net income, same period

Newsletter

Get the teardowns by email

Subscribe if you want the public-company teardowns in your inbox when they're released.

Product waitlist

Health Check and Teardown for your own company

A health check uncovers insights of your private books, not a public ticker. Join this list to get notified as soon as we go-live!