
MORGAN STANLEY (MS) FY2025 Annual Balance Sheet

Balance Sheet

As of 2025-12-31

Swipe to see the full flow
MORGAN STANLEY (MS) FY2025 Annual Balance SheetBalance sheet as of 2025-12-31. The chart shows assets, liabilities and equity at that date.Liabilities$1.31 TAssets$1.42 TEquity$112.65 BGross equity(calculated)$162.19 BHOLDINGSASSETSCLAIM CLASSCLAIM SUB-CLASSCLAIMSTrading assets at fair value ($213,269 and $148,945 were pledged to various parties)Held for investment (net of allowance for credit losses of $1,132 and $1,066)Securities borrowedSecurities purchased under agreements to resell (includes $— and $— at fair value)Customer and other receivablesCash and cash equivalentsAvailable-for-sale at fair value (amortized cost of $112,522 and $101,960)Held-to-maturity (fair value of $45,615 and $51,203)Other assetsGoodwillHeld for saleIntangible assets (net of accumulated amortization of $1,882 and $5,445)Deposits (includes $8,755 and $6,499 at fair value)Borrowings (includes $132,479 and $103,332 at fair value)Customer and other payablesTrading liabilities at fair valueSecurities sold under agreements to repurchase (includes $696 and $956 at fair value)Other liabilities and accrued expensesOther secured financings (includes $16,871 and $14,088 at fair value)Securities loanedRetained earningsAdditional paid-in capitalPreferred stockEmployee stock trustsCommon stockNoncontrolling interestsAssetsLiabilitiesEquityGross equity (calculated)Common stock held in treasury at cost, $0.01 par value (456,059,842 and 432,240,273 shares)Accumulated other comprehensive income (loss)Common stock issued to employee stock trustsDeposits (includes $8,755 and $6,499 at fair value)Deposits (includes $8,755 and $6,499 at fair value)$415.52 BLiabilitiesLiabilities$1.31 TTrading assets at fair value ($213,269 and $148,945 were pledged to various parties)Trading assets at fair value$428.28 BBorrowings (includes $132,479 and $103,332 at fair value)Borrowings$348.94 BAssetsAssets$1.42 THeld for investment (net of allowance for credit losses of $1,132 and $1,066)Held for investment$268.72 BCustomer and other payablesCustomer and other payables$226.52 BSecurities borrowedSecurities borrowed$151.91 BTrading liabilities at fair valueTrading liabilities at fair value$169.57 BSecurities purchased under agreements to resell (includes $— and $— at fair value)Securities purchased under agreements to resell$120.24 BSecurities sold under agreements to repurchase (includes $696 and $956 at fair value)Securities sold under agreements to repurchase$78.54 BCustomer and other receivablesCustomer and other receivables$114.72 BOther liabilities and accrued expensesOther liabilities and accrued expenses$29.62 BCash and cash equivalentsCash and cash equivalents$111.70 BOther secured financings (includes $16,871 and $14,088 at fair value)Other secured financings$21.60 BAvailable-for-sale at fair value (amortized cost of $112,522 and $101,960)Available-for-sale at fair value$110.47 BSecurities loanedSecurities loaned$17.31 BHeld-to-maturity (fair value of $45,615 and $51,203)Held-to-maturity (fair value of $45,615 and $51,203)$53.09 BEquityEquity$112.65 BRetained earningsRetained earnings$115.09 BOther assetsOther assets$29.04 BAdditional paid-in capitalAdditional paid-in capital$31.15 BGross equity (calculated)Gross equity(calculated)$162.19 BGoodwillGoodwill$16.73 BPreferred stockPreferred stock$9.75 BHeld for saleHeld for sale$9.37 BEmployee stock trustsEmployee stock trusts$5.15 BIntangible assets (net of accumulated amortization of $1,882 and $5,445)Intangible assets$6.01 BCommon stockCommon stock$20.00 MNoncontrolling interestsNoncontrolling interests$1.02 BCommon stock held in treasury at cost, $0.01 par value (456,059,842 and 432,240,273 shares)Common stock held in treasury at cost−$38.10 BAccumulated other comprehensive income (loss)Accumulated other comprehensive income (loss)−$6.29 BCommon stock issued to employee stock trustsCommon stock issued to employee stock trusts−$5.15 B
Chart details

MORGAN STANLEY (MS) FY2025 Annual Balance Sheet

Balance sheet as of 2025-12-31. The chart shows assets, liabilities and equity at that date.

Assets
1,420,270,000,000 US dollars
Liabilities
1,307,618,000,000 US dollars
Equity
112,652,000,000 US dollars
Noncontrolling interest
1,020,000,000 US dollars. Included in consolidated equity; this amount is not added again.
Trading assets at fair value ($213,269 and $148,945 were pledged to various parties)
428,276,000,000 US dollars
Held for investment (net of allowance for credit losses of $1,132 and $1,066)
268,720,000,000 US dollars
Securities borrowed
151,908,000,000 US dollars
Securities purchased under agreements to resell (includes $— and $— at fair value)
120,243,000,000 US dollars
Customer and other receivables
114,720,000,000 US dollars
Cash and cash equivalents
111,695,000,000 US dollars
Available-for-sale at fair value (amortized cost of $112,522 and $101,960)
110,466,000,000 US dollars
Held-to-maturity (fair value of $45,615 and $51,203)
53,090,000,000 US dollars
Other assets
29,042,000,000 US dollars
Goodwill
16,726,000,000 US dollars
Held for sale
9,374,000,000 US dollars
Intangible assets (net of accumulated amortization of $1,882 and $5,445)
6,010,000,000 US dollars
Deposits (includes $8,755 and $6,499 at fair value)
415,523,000,000 US dollars
Borrowings (includes $132,479 and $103,332 at fair value)
348,935,000,000 US dollars
Customer and other payables
226,519,000,000 US dollars
Trading liabilities at fair value
169,569,000,000 US dollars
Securities sold under agreements to repurchase (includes $696 and $956 at fair value)
78,539,000,000 US dollars
Other liabilities and accrued expenses
29,620,000,000 US dollars
Other secured financings (includes $16,871 and $14,088 at fair value)
21,603,000,000 US dollars
Securities loaned
17,310,000,000 US dollars
Retained earnings
115,091,000,000 US dollars
Additional paid-in capital
31,153,000,000 US dollars
Preferred stock
9,750,000,000 US dollars
Employee stock trusts
5,154,000,000 US dollars
Common stock
20,000,000 US dollars
Noncontrolling interests
1,020,000,000 US dollars
Common stock held in treasury at cost, $0.01 par value (456,059,842 and 432,240,273 shares)
negative 38,097,000,000 US dollars
Accumulated other comprehensive income (loss)
negative 6,285,000,000 US dollars
Common stock issued to employee stock trusts
negative 5,154,000,000 US dollars
Gross equity (calculated)
162,188,000,000 US dollars. Net equity plus the magnitudes of its negative contributions equals gross positive equity. The negative contributions enter this reconciliation as add-backs; their filed signs stay negative.

Chart connections

  • Assets equal liabilities plus consolidated equity. Consolidated equity includes noncontrolling interests when reported.
  • Treasury shares and other negative equity contributions reduce equity.
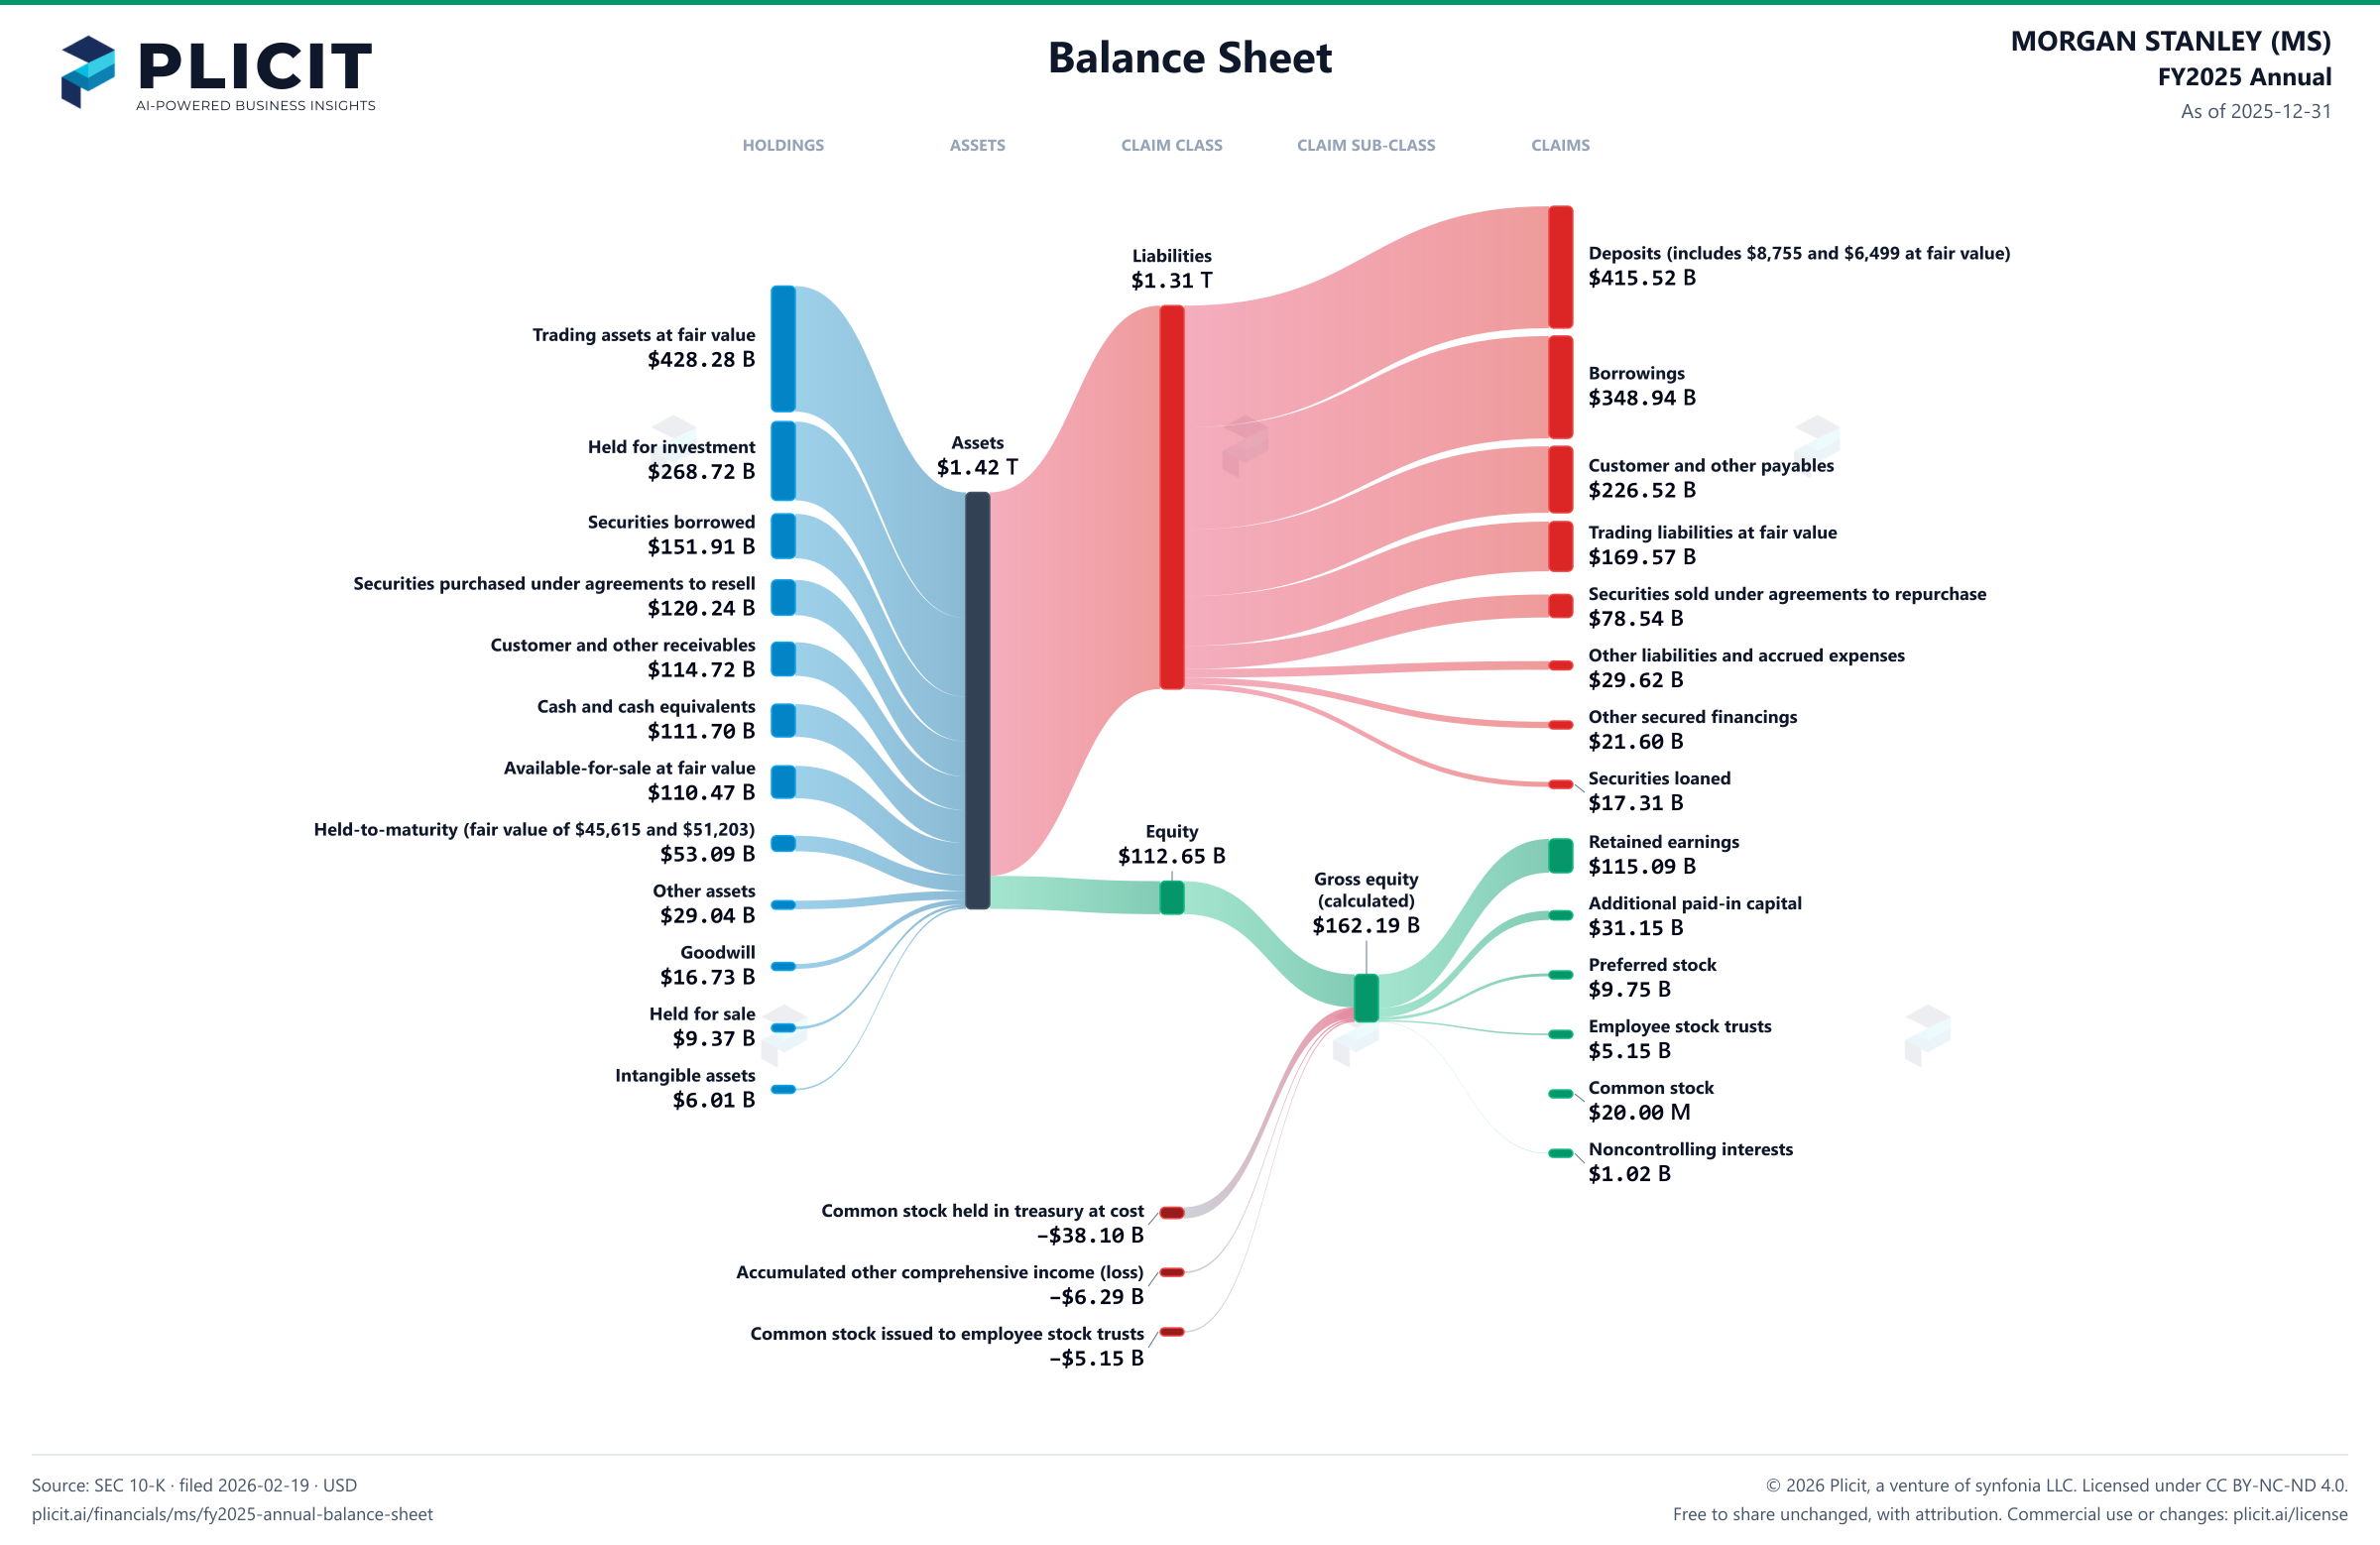
MORGAN STANLEY (MS) FY2025 Annual Balance Sheet Sankey chart
Free to share unchanged, with credit to Plicit.ai · CC BY-NC-ND 4.0Download PNG

Newsletter

Get the teardowns by email

Subscribe if you want the public-company teardowns in your inbox when they're released.

Product waitlist

Health Check and Teardown for your own company

A health check uncovers insights of your private books, not a public ticker. Join this list to get notified as soon as we go-live!