
MORGAN STANLEY (MS) FY2026 Q1 Balance Sheet
As of 2026-03-31
Balance Sheet
As of 2026-03-31
Swipe to see the full flow
Chart details
MORGAN STANLEY (MS) FY2026 Q1 Balance Sheet
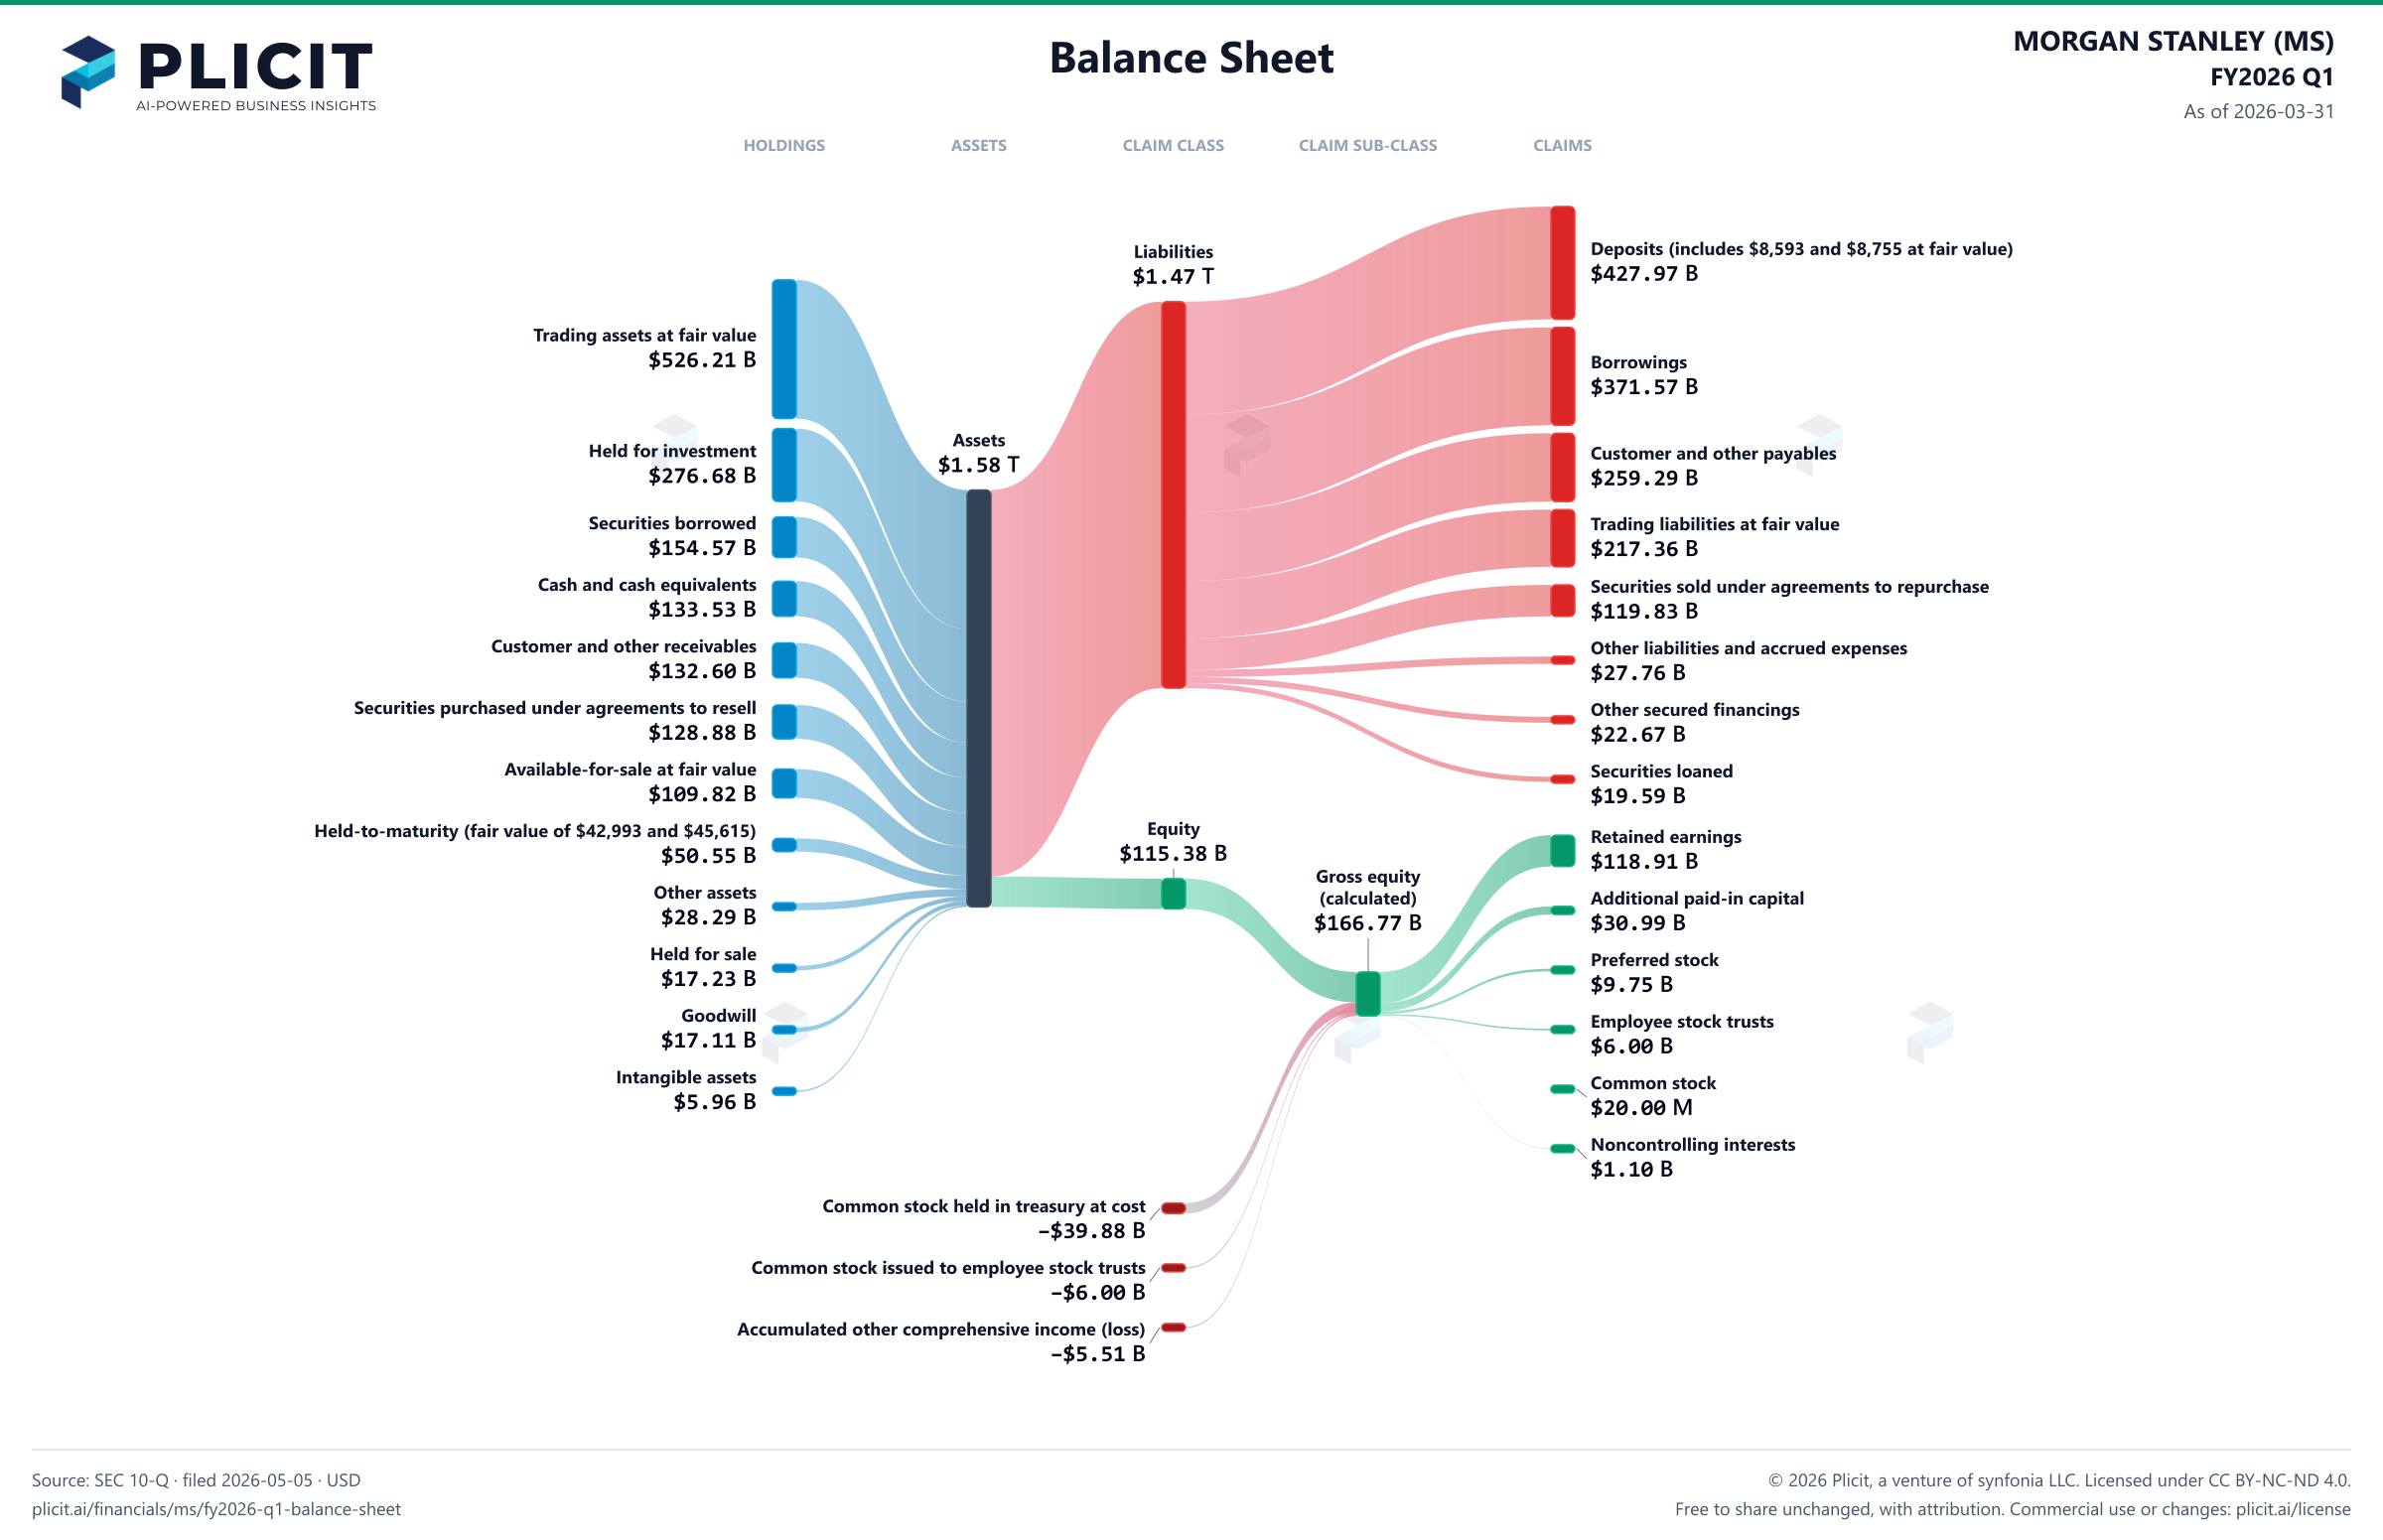
Balance sheet as of 2026-03-31. The chart shows assets, liabilities and equity at that date.
- Assets
- 1,581,418,000,000 US dollars
- Liabilities
- 1,466,034,000,000 US dollars
- Equity
- 115,384,000,000 US dollars
- Noncontrolling interest
- 1,098,000,000 US dollars. Included in consolidated equity; this amount is not added again.
- Trading assets at fair value ($283,742 and $213,269 pledged as collateral)
- 526,211,000,000 US dollars
- Held for investment (net of allowance for credit losses of $1,174 and $1,132)
- 276,683,000,000 US dollars
- Securities borrowed
- 154,570,000,000 US dollars
- Cash and cash equivalents
- 133,529,000,000 US dollars
- Customer and other receivables
- 132,599,000,000 US dollars
- Securities purchased under agreements to resell (includes $— and $— at fair value)
- 128,880,000,000 US dollars
- Available-for-sale at fair value (amortized cost of $112,050 and $112,522)
- 109,817,000,000 US dollars
- Held-to-maturity (fair value of $42,993 and $45,615)
- 50,546,000,000 US dollars
- Other assets
- 28,287,000,000 US dollars
- Held for sale
- 17,231,000,000 US dollars
- Goodwill
- 17,105,000,000 US dollars
- Intangible assets (net of accumulated amortization of $1,968 and $1,882)
- 5,960,000,000 US dollars
- Deposits (includes $8,593 and $8,755 at fair value)
- 427,971,000,000 US dollars
- Borrowings (includes $137,633 and $132,479 at fair value)
- 371,568,000,000 US dollars
- Customer and other payables
- 259,289,000,000 US dollars
- Trading liabilities at fair value
- 217,356,000,000 US dollars
- Securities sold under agreements to repurchase (includes $699 and $696 at fair value)
- 119,831,000,000 US dollars
- Other liabilities and accrued expenses
- 27,764,000,000 US dollars
- Other secured financings (includes $17,533 and $16,871 at fair value)
- 22,666,000,000 US dollars
- Securities loaned
- 19,589,000,000 US dollars
- Retained earnings
- 118,913,000,000 US dollars
- Additional paid-in capital
- 30,988,000,000 US dollars
- Preferred stock
- 9,750,000,000 US dollars
- Employee stock trusts
- 6,003,000,000 US dollars
- Common stock
- 20,000,000 US dollars
- Noncontrolling interests
- 1,098,000,000 US dollars
- Common stock held in treasury at cost, $0.01 par value (459,264,681 and 456,059,842 shares)
- negative 39,879,000,000 US dollars
- Common stock issued to employee stock trusts
- negative 6,003,000,000 US dollars
- Accumulated other comprehensive income (loss)
- negative 5,506,000,000 US dollars
- Gross equity (calculated)
- 166,772,000,000 US dollars. Net equity plus the magnitudes of its negative contributions equals gross positive equity. The negative contributions enter this reconciliation as add-backs; their filed signs stay negative.
Chart connections
- Assets equal liabilities plus consolidated equity. Consolidated equity includes noncontrolling interests when reported.
- Treasury shares and other negative equity contributions reduce equity.
Free to share unchanged, with credit to Plicit.ai · CC BY-NC-ND 4.0Download PNG
Product waitlist
Health Check and Teardown for your own company
A health check uncovers insights of your private books, not a public ticker. Join this list to get notified as soon as we go-live!