
OIL-DRI CORPORATION OF AMERICA (ODC) FY2026 Annual Balance Sheet
As of 2026-07-31
Balance Sheet
As of 2026-07-31
Swipe to see the full flow
Chart details
OIL-DRI CORPORATION OF AMERICA (ODC) FY2026 Annual Balance Sheet
Balance sheet as of 2026-07-31. The chart shows assets, liabilities and equity at that date.
- Assets
- 428,786,000 US dollars
- Current assets
- 208,647,000 US dollars
- Non-current assets
- 220,139,000 US dollars
- Liabilities
- 131,056,000 US dollars
- Current liabilities
- 68,044,000 US dollars
- Non-current liabilities
- 63,012,000 US dollars
- Equity
- 297,730,000 US dollars
- Land
- 13,914,000 US dollars. Part of Total Property, Plant and Equipment, Net, drawn as one net amount.
- Buildings and leasehold improvements
- 48,019,000 US dollars. Part of Total Property, Plant and Equipment, Net, drawn as one net amount.
- Machinery and equipment
- 224,169,000 US dollars. Part of Total Property, Plant and Equipment, Net, drawn as one net amount.
- Office furniture and equipment
- 23,488,000 US dollars. Part of Total Property, Plant and Equipment, Net, drawn as one net amount.
- Vehicles
- 29,215,000 US dollars. Part of Total Property, Plant and Equipment, Net, drawn as one net amount.
- Construction in progress
- 17,235,000 US dollars. Part of Total Property, Plant and Equipment, Net, drawn as one net amount.
- Mining assets
- 10,787,000 US dollars. Part of Total Property, Plant and Equipment, Net, drawn as one net amount.
- Capital Parts
- 9,984,000 US dollars. Part of Total Property, Plant and Equipment, Net, drawn as one net amount.
- Less accumulated depreciation and amortization
- negative 216,596,000 US dollars. Part of Total Property, Plant and Equipment, Net, drawn as one net amount.
- Accounts receivable, less allowance of $902 and $1,493 in 2026 and 2025, respectively
- 75,438,000 US dollars
- Cash and cash equivalents
- 73,700,000 US dollars
- Inventories, net
- 53,489,000 US dollars
- Prepaid expenses and other assets
- 6,020,000 US dollars
- Total Property, Plant and Equipment, Net
- 160,215,000 US dollars
- Customer list, net of accumulated amortization of $10,407 and $9,278 in 2026 and 2025, respectively
- 17,778,000 US dollars
- Goodwill
- 16,017,000 US dollars
- Operating lease right-of-use assets
- 13,026,000 US dollars
- Trademarks, trade names and patents, net of accumulated amortization of $751 and $693 in 2026 and 2025, respectively
- 6,576,000 US dollars
- Other
- 6,302,000 US dollars
- Deferred income taxes
- 225,000 US dollars
- Accrued expenses
- 44,258,000 US dollars
- Accounts Payable
- 16,118,000 US dollars
- Operating lease liabilities
- 3,651,000 US dollars
- Dividends payable
- 3,017,000 US dollars
- Current maturities of notes payable
- 1,000,000 US dollars
- Long-term debt, net of unamortized debt issuance costs of $143 and $183 in 2026 and 2025, respectively
- 37,857,000 US dollars
- Long-term operating lease liabilities
- 11,064,000 US dollars
- Other
- 7,382,000 US dollars
- Deferred compensation
- 5,924,000 US dollars
- Deferred income taxes
- 785,000 US dollars
- Retained earnings
- 323,520,000 US dollars
- Additional paid-in capital
- 71,812,000 US dollars
- Common Stock, par value $.10 - Common Stock
- 1,535,000 US dollars
- Accumulated other comprehensive income
- 908,000 US dollars
- Common Stock, par value $.10 - Class B
- 465,000 US dollars
- Less treasury stock, at cost (5,103,568 Common and 416,544 Class B shares in 2026 and 4,902,881 Common and 380,628 Class B shares in 2025)
- negative 100,510,000 US dollars
- Gross equity (calculated)
- 398,240,000 US dollars. Net equity plus the magnitudes of its negative contributions equals gross positive equity. The negative contributions enter this reconciliation as add-backs; their filed signs stay negative.
Chart connections
- Assets equal liabilities plus consolidated equity. Consolidated equity includes noncontrolling interests when reported.
- Treasury shares and other negative equity contributions reduce equity.
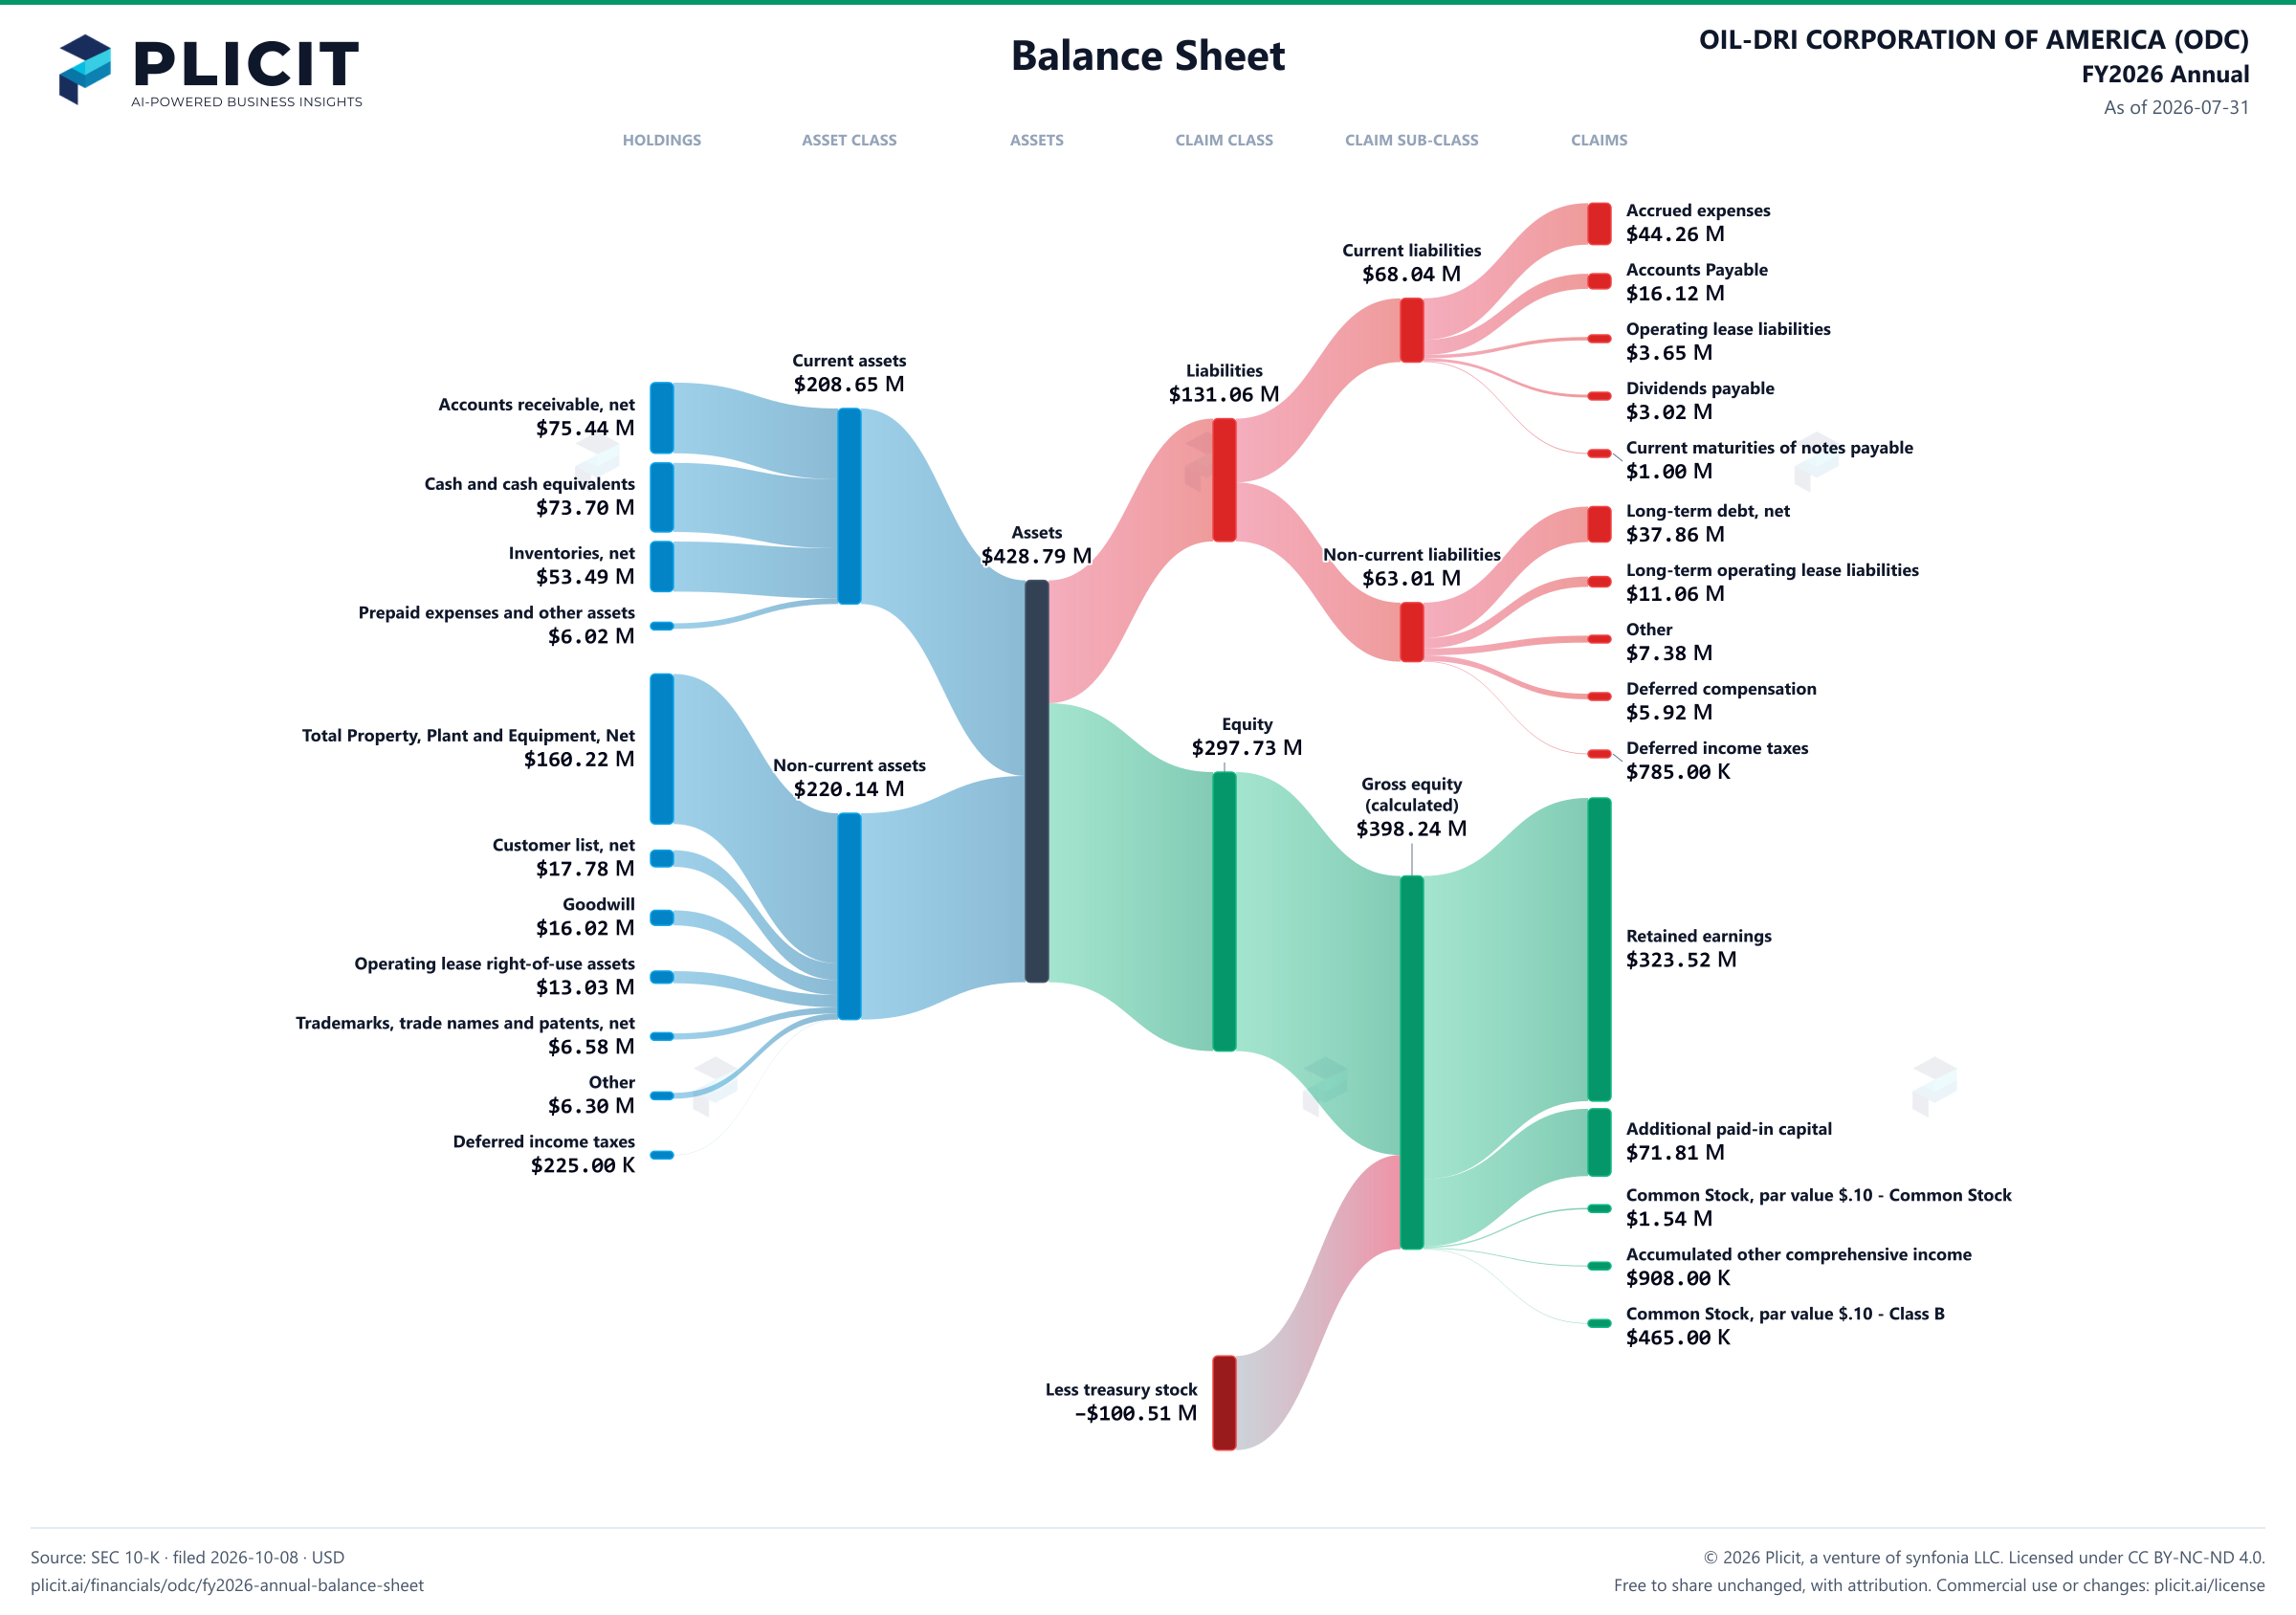
Free to share unchanged, with credit to Plicit.ai · CC BY-NC-ND 4.0Download PNG
Product waitlist
Health Check and Teardown for your own company
A health check uncovers insights of your private books, not a public ticker. Join this list to get notified as soon as we go-live!