
Philip Morris International Inc. (PM) FY2024 Q3 Balance Sheet
As of 2024-09-30
Balance Sheet
As of 2024-09-30
Swipe to see the full flow
Chart details
Philip Morris International Inc. (PM) FY2024 Q3 Balance Sheet
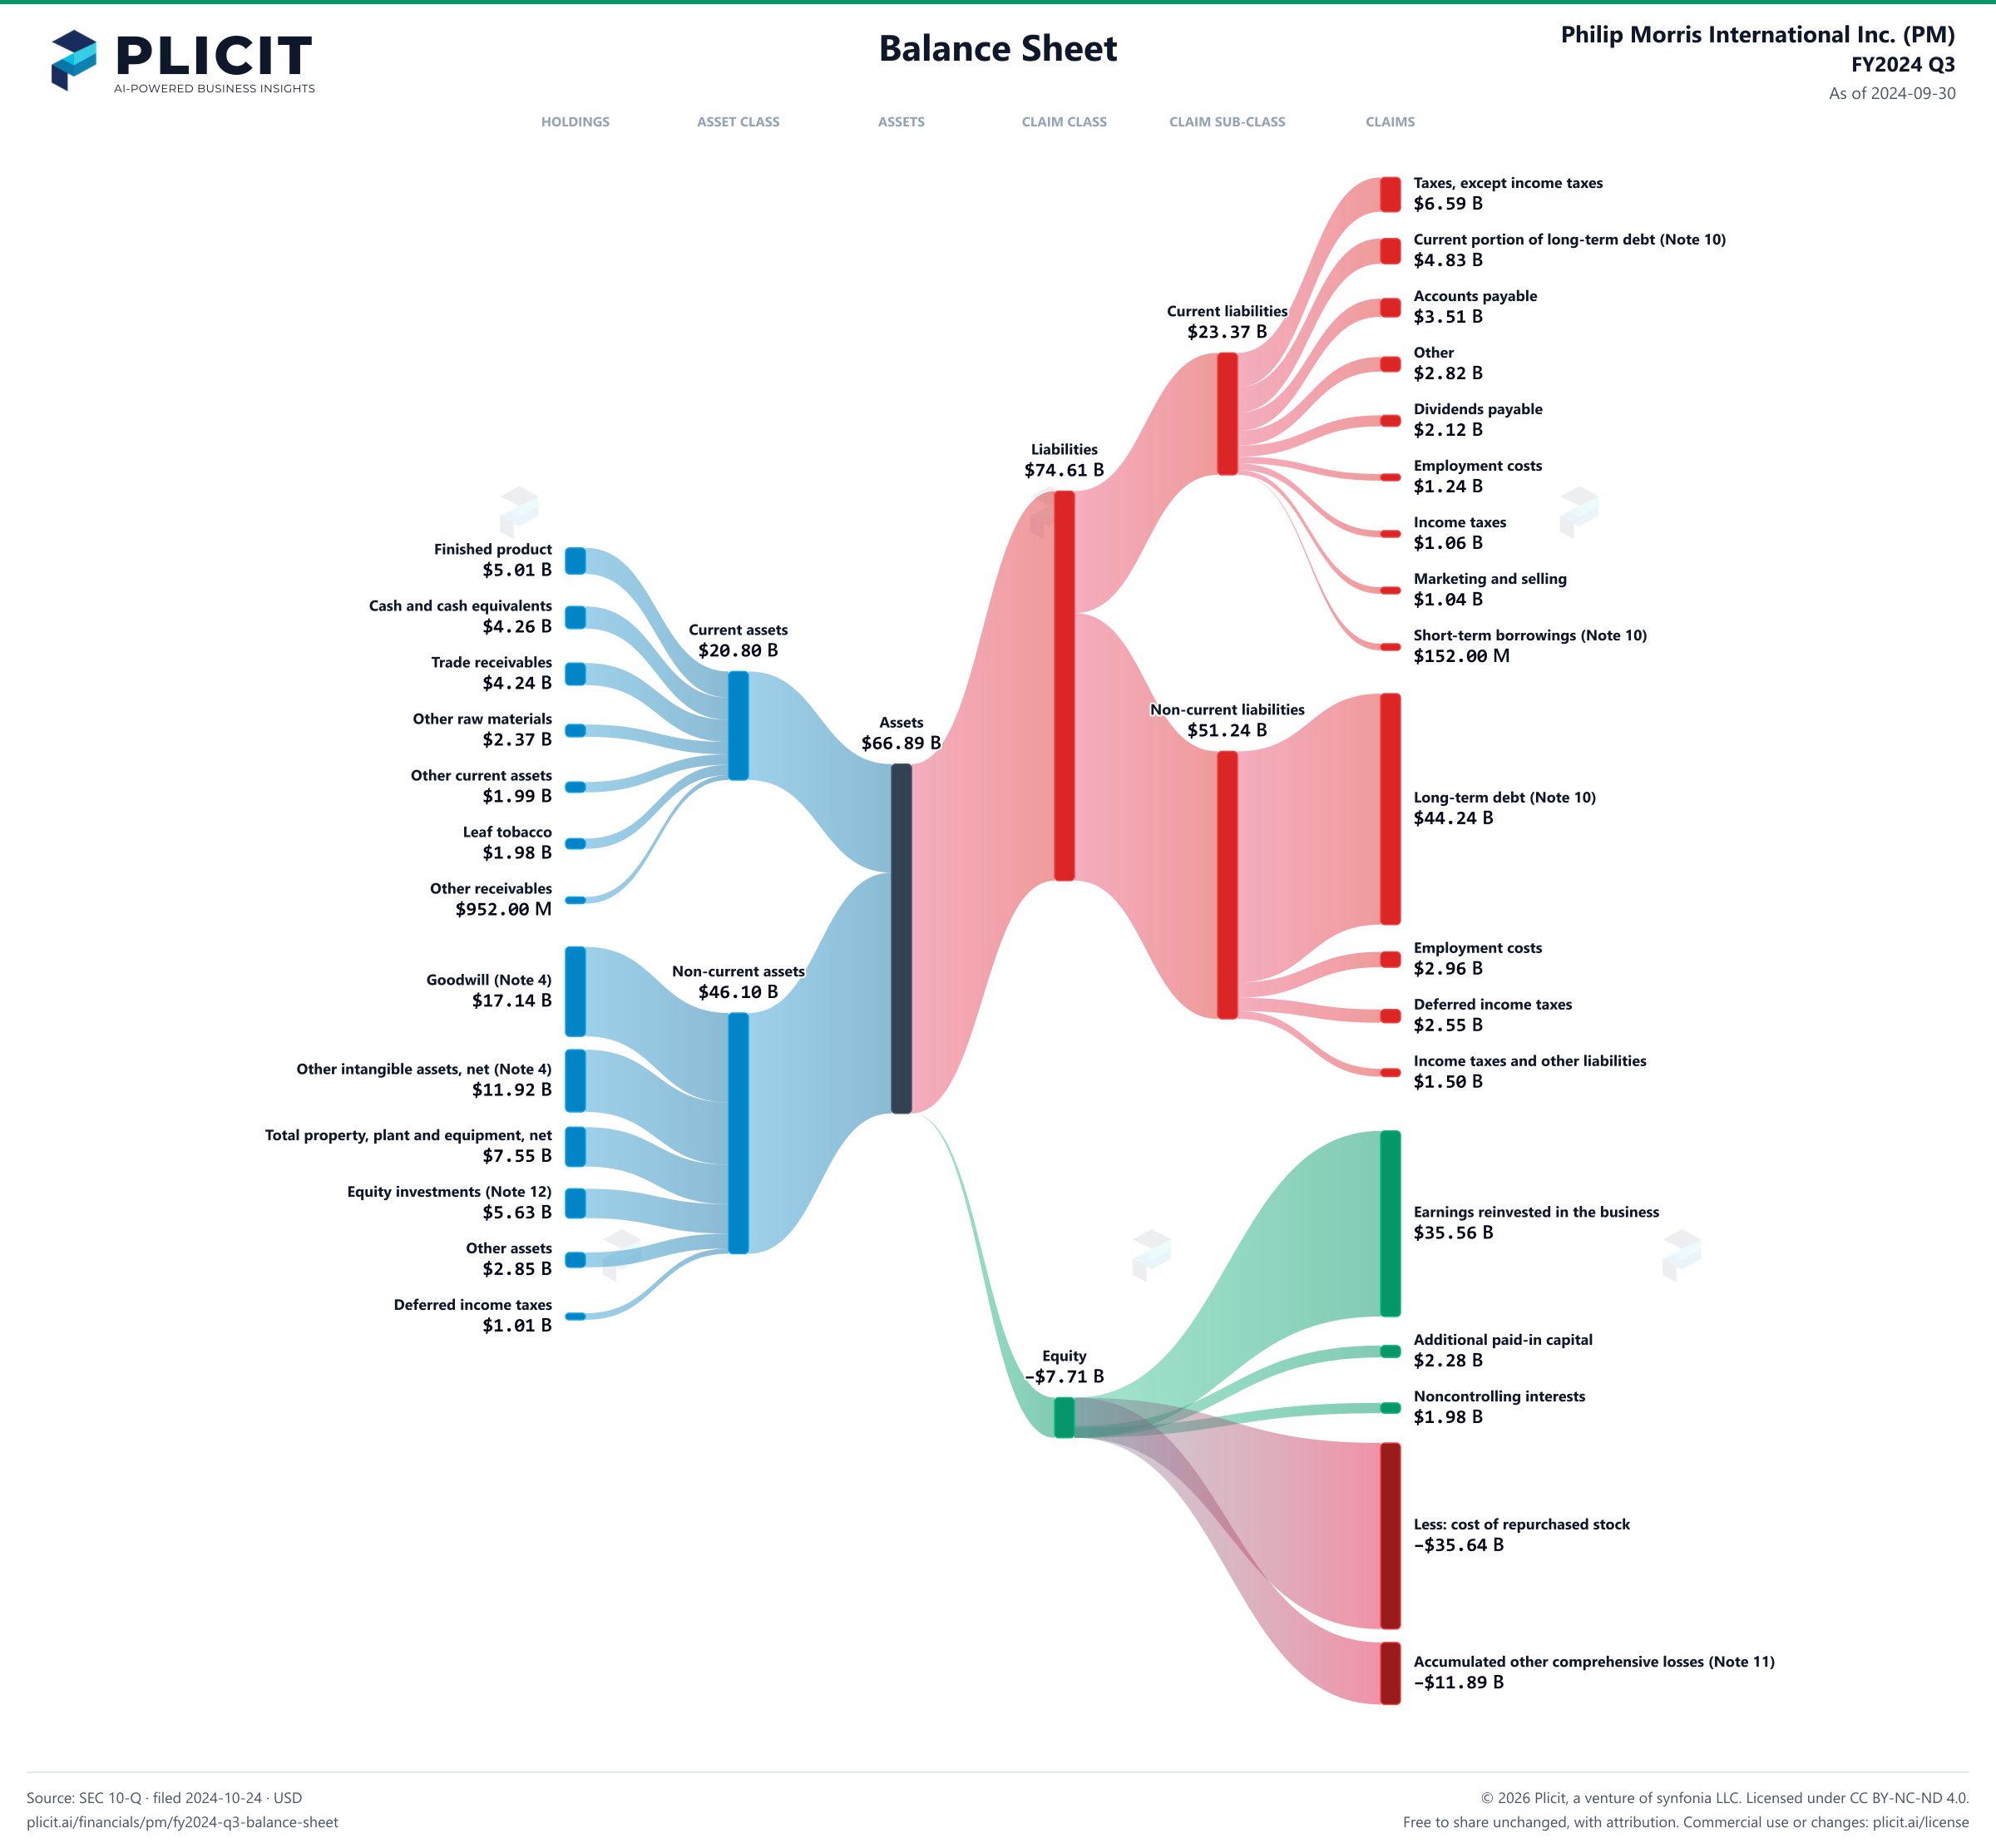
Balance sheet as of 2024-09-30. The chart shows assets, liabilities and equity at that date.
- Assets
- 66,892,000,000 US dollars
- Current assets
- 20,796,000,000 US dollars
- Non-current assets
- 46,096,000,000 US dollars
- Liabilities
- 74,605,000,000 US dollars
- Current liabilities
- 23,366,000,000 US dollars
- Non-current liabilities
- 51,239,000,000 US dollars
- Equity
- negative 7,713,000,000 US dollars
- Noncontrolling interest
- 1,981,000,000 US dollars. Included in consolidated equity; this amount is not added again.
- Less: accumulated depreciation
- negative 9,964,000,000 US dollars. Part of Total property, plant and equipment, net, drawn as one net amount.
- Property, plant and equipment, at cost
- 17,512,000,000 US dollars. Part of Total property, plant and equipment, net, drawn as one net amount.
- Finished product
- 5,007,000,000 US dollars
- Cash and cash equivalents
- 4,258,000,000 US dollars
- Trade receivables (less allowances of $54 in 2024 and $79 in 2023)
- 4,239,000,000 US dollars
- Other raw materials
- 2,368,000,000 US dollars
- Other current assets
- 1,992,000,000 US dollars
- Leaf tobacco
- 1,980,000,000 US dollars
- Other receivables (less allowances of $21 in 2024 and $35 in 2023)
- 952,000,000 US dollars
- Goodwill (Note 4)
- 17,144,000,000 US dollars
- Other intangible assets, net (Note 4)
- 11,916,000,000 US dollars
- Total property, plant and equipment, net
- 7,548,000,000 US dollars
- Equity investments (Note 12)
- 5,631,000,000 US dollars
- Other assets (less allowances of $26 in 2024 and $25 in 2023) (Note 18)
- 2,845,000,000 US dollars
- Deferred income taxes
- 1,012,000,000 US dollars
- Taxes, except income taxes
- 6,594,000,000 US dollars
- Current portion of long-term debt (Note 10)
- 4,833,000,000 US dollars
- Accounts payable
- 3,511,000,000 US dollars
- Other
- 2,820,000,000 US dollars
- Dividends payable
- 2,119,000,000 US dollars
- Employment costs
- 1,235,000,000 US dollars
- Income taxes
- 1,059,000,000 US dollars
- Marketing and selling
- 1,043,000,000 US dollars
- Short-term borrowings (Note 10)
- 152,000,000 US dollars
- Long-term debt (Note 10)
- 44,237,000,000 US dollars
- Employment costs
- 2,957,000,000 US dollars
- Deferred income taxes
- 2,547,000,000 US dollars
- Income taxes and other liabilities
- 1,498,000,000 US dollars
- Earnings reinvested in the business
- 35,556,000,000 US dollars
- Additional paid-in capital
- 2,283,000,000 US dollars
- Common stock, no par value (2,109,316,331 shares issued in 2024 and 2023)
- 0 US dollars
- Noncontrolling interests
- 1,981,000,000 US dollars
- Less: cost of repurchased stock (554,486,775 and 556,891,800 shares in 2024 and 2023, respectively)
- negative 35,641,000,000 US dollars
- Accumulated other comprehensive losses (Note 11)
- negative 11,892,000,000 US dollars
Chart connections
- Assets equal liabilities plus consolidated equity. Consolidated equity includes noncontrolling interests when reported.
- Treasury shares and other negative equity contributions reduce equity.
Free to share unchanged, with credit to Plicit.ai · CC BY-NC-ND 4.0Download PNG
Product waitlist
Health Check and Teardown for your own company
A health check uncovers insights of your private books, not a public ticker. Join this list to get notified as soon as we go-live!