
Philip Morris International Inc. (PM) FY2025 Q1 Balance Sheet

Balance Sheet

As of 2025-03-31

Swipe to see the full flow
Philip Morris International Inc. (PM) FY2025 Q1 Balance SheetBalance sheet as of 2025-03-31. The chart shows assets, liabilities and equity at that date.Current liabilities$28.09 BLiabilities$74.01 BCurrent assets$22.20 BNon-current liabilities$45.92 BAssets$65.08 BNon-current assets$42.88 BEquity−$8.93 BHOLDINGSASSET CLASSASSETSCLAIM CLASSCLAIM SUB-CLASSCLAIMSFinished productTrade receivables (less allowances of $42 in 2025 and $47 in 2024)Cash and cash equivalentsOther raw materialsLeaf tobaccoOther current assetsOther receivables (less allowances of $22 in 2025 and $22 in 2024)Goodwill (Note 5)Other intangible assets, net (Note 5)Total property, plant and equipment, netEquity investments (Note 13)Other assets (less allowances of $27 in 2025 and $26 in 2024)Deferred income taxesCurrent portion of long-term debt (Note 11)Taxes, except income taxesShort-term borrowings (Note 11)Accounts payableOtherDividends payableIncome taxesEmployment costsMarketing and sellingLong-term debt (Note 11)Employment costsDeferred income taxesOther liabilitiesEarnings reinvested in the businessAdditional paid-in capitalNoncontrolling interestsLess: cost of repurchased stock (552,827,233 and 554,470,731 shares in 2025 and 2024, respectively)Accumulated other comprehensive losses (Note 12)Current assetsNon-current assetsAssetsCurrent liabilitiesNon-current liabilitiesLiabilitiesEquityCurrent portion of long-term debt (Note 11)Current portion of long-term debt (Note 11)$6.36 BTaxes, except income taxesTaxes, except income taxes$5.64 BShort-term borrowings (Note 11)Short-term borrowings (Note 11)$4.44 BCurrent liabilitiesCurrent liabilities$28.09 BAccounts payableAccounts payable$3.75 BOtherOther$2.49 BLiabilitiesLiabilities$74.01 BDividends payableDividends payable$2.12 BIncome taxesIncome taxes$1.32 BFinished productFinished product$5.33 BEmployment costsEmployment costs$1.02 BTrade receivables (less allowances of $42 in 2025 and $47 in 2024)Trade receivables$4.88 BCurrent assetsCurrent assets$22.20 BMarketing and sellingMarketing and selling$949.00 MCash and cash equivalentsCash and cash equivalents$4.44 BOther raw materialsOther raw materials$2.63 BNon-current liabilitiesNon-current liabilities$45.92 BAssetsAssets$65.08 BLeaf tobaccoLeaf tobacco$2.17 BLong-term debt (Note 11)Long-term debt (Note 11)$38.78 BOther current assetsOther current assets$1.83 BOther receivables (less allowances of $22 in 2025 and $22 in 2024)Other receivables$913.00 MEmployment costsEmployment costs$2.99 BNon-current assetsNon-current assets$42.88 BGoodwill (Note 5)Goodwill (Note 5)$16.86 BDeferred income taxesDeferred income taxes$2.82 BOther liabilitiesOther liabilities$1.33 BOther intangible assets, net (Note 5)Other intangible assets, net (Note 5)$11.35 BTotal property, plant and equipment, netTotal property, plant and equipment, net$7.53 BEquity investments (Note 13)Equity investments (Note 13)$2.97 BEarnings reinvested in the businessEarnings reinvested in the business$33.45 BOther assets (less allowances of $27 in 2025 and $26 in 2024)Other assets$2.88 BDeferred income taxesDeferred income taxes$1.29 BAdditional paid-in capitalAdditional paid-in capital$2.33 BEquityEquity−$8.93 BNoncontrolling interestsNoncontrolling interests$1.98 BLess: cost of repurchased stock (552,827,233 and 554,470,731 shares in 2025 and 2024, respectively)Less: cost of repurchased stock−$35.56 BAccumulated other comprehensive losses (Note 12)Accumulated other comprehensive losses (Note 12)−$11.12 B
Chart details

Philip Morris International Inc. (PM) FY2025 Q1 Balance Sheet

Balance sheet as of 2025-03-31. The chart shows assets, liabilities and equity at that date.

Assets
65,079,000,000 US dollars
Current assets
22,196,000,000 US dollars
Non-current assets
42,883,000,000 US dollars
Liabilities
74,005,000,000 US dollars
Current liabilities
28,087,000,000 US dollars
Non-current liabilities
45,918,000,000 US dollars
Equity
negative 8,926,000,000 US dollars
Noncontrolling interest
1,975,000,000 US dollars. Included in consolidated equity; this amount is not added again.
Less: accumulated depreciation
negative 9,896,000,000 US dollars. Part of Total property, plant and equipment, net, drawn as one net amount.
Property, plant and equipment, at cost
17,428,000,000 US dollars. Part of Total property, plant and equipment, net, drawn as one net amount.
Finished product
5,330,000,000 US dollars
Trade receivables (less allowances of $42 in 2025 and $47 in 2024)
4,880,000,000 US dollars
Cash and cash equivalents
4,443,000,000 US dollars
Other raw materials
2,631,000,000 US dollars
Leaf tobacco
2,166,000,000 US dollars
Other current assets
1,833,000,000 US dollars
Other receivables (less allowances of $22 in 2025 and $22 in 2024)
913,000,000 US dollars
Goodwill (Note 5)
16,864,000,000 US dollars
Other intangible assets, net (Note 5)
11,345,000,000 US dollars
Total property, plant and equipment, net
7,532,000,000 US dollars
Equity investments (Note 13)
2,972,000,000 US dollars
Other assets (less allowances of $27 in 2025 and $26 in 2024)
2,883,000,000 US dollars
Deferred income taxes
1,287,000,000 US dollars
Current portion of long-term debt (Note 11)
6,360,000,000 US dollars
Taxes, except income taxes
5,640,000,000 US dollars
Short-term borrowings (Note 11)
4,438,000,000 US dollars
Accounts payable
3,749,000,000 US dollars
Other
2,491,000,000 US dollars
Dividends payable
2,121,000,000 US dollars
Income taxes
1,323,000,000 US dollars
Employment costs
1,016,000,000 US dollars
Marketing and selling
949,000,000 US dollars
Long-term debt (Note 11)
38,781,000,000 US dollars
Employment costs
2,991,000,000 US dollars
Deferred income taxes
2,817,000,000 US dollars
Other liabilities
1,329,000,000 US dollars
Earnings reinvested in the business
33,447,000,000 US dollars
Additional paid-in capital
2,326,000,000 US dollars
Common stock, no par value (2,109,316,331 shares issued in 2025 and 2024)
0 US dollars
Noncontrolling interests
1,975,000,000 US dollars
Less: cost of repurchased stock (552,827,233 and 554,470,731 shares in 2025 and 2024, respectively)
negative 35,557,000,000 US dollars
Accumulated other comprehensive losses (Note 12)
negative 11,117,000,000 US dollars

Chart connections

  • Assets equal liabilities plus consolidated equity. Consolidated equity includes noncontrolling interests when reported.
  • Treasury shares and other negative equity contributions reduce equity.
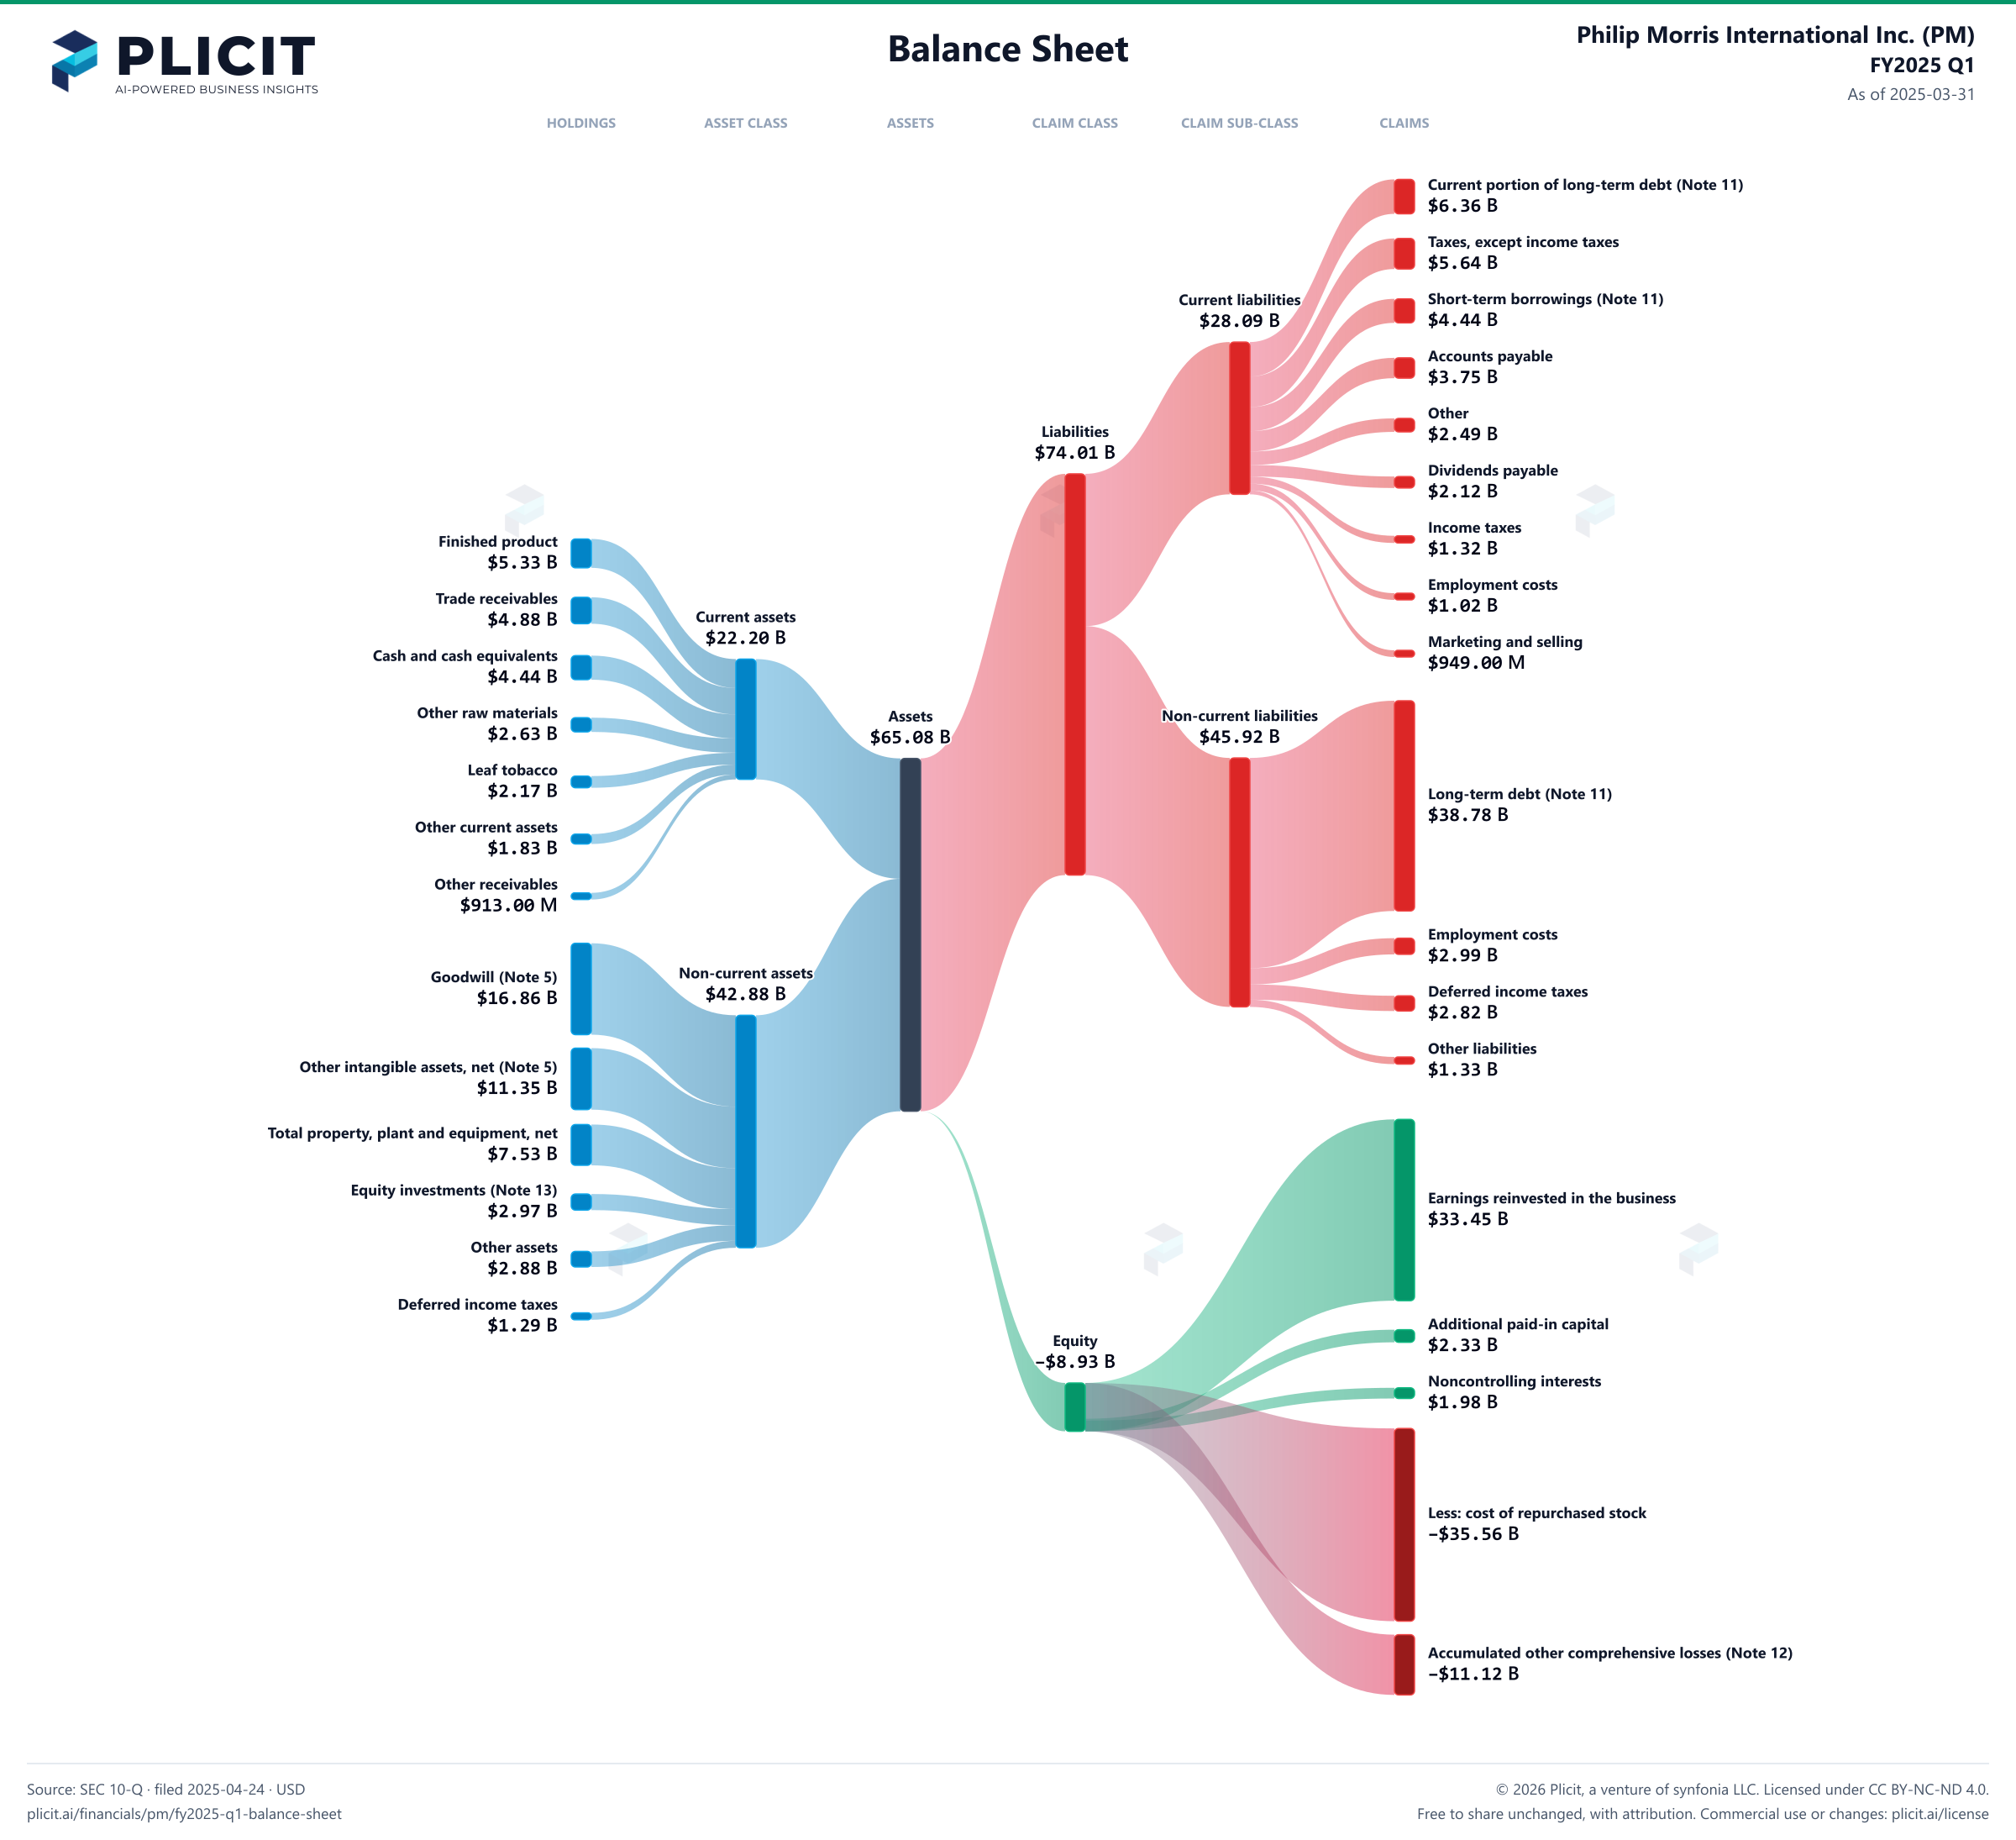
Philip Morris International Inc. (PM) FY2025 Q1 Balance Sheet Sankey chart
Free to share unchanged, with credit to Plicit.ai · CC BY-NC-ND 4.0Download PNG

Newsletter

Get the teardowns by email

Subscribe if you want the public-company teardowns in your inbox when they're released.

Product waitlist

Health Check and Teardown for your own company

A health check uncovers insights of your private books, not a public ticker. Join this list to get notified as soon as we go-live!