
PHILIP MORRIS INTERNATIONAL INC. (PM) FY2025 Annual P&L / Income Statement
2025-01-01 to 2025-12-31
Revenue by Business Segment
2025-01-01 to 2025-12-31
Swipe to see the full flow
Chart details
PHILIP MORRIS INTERNATIONAL INC. (PM) FY2025 Annual P&L / Income Statement
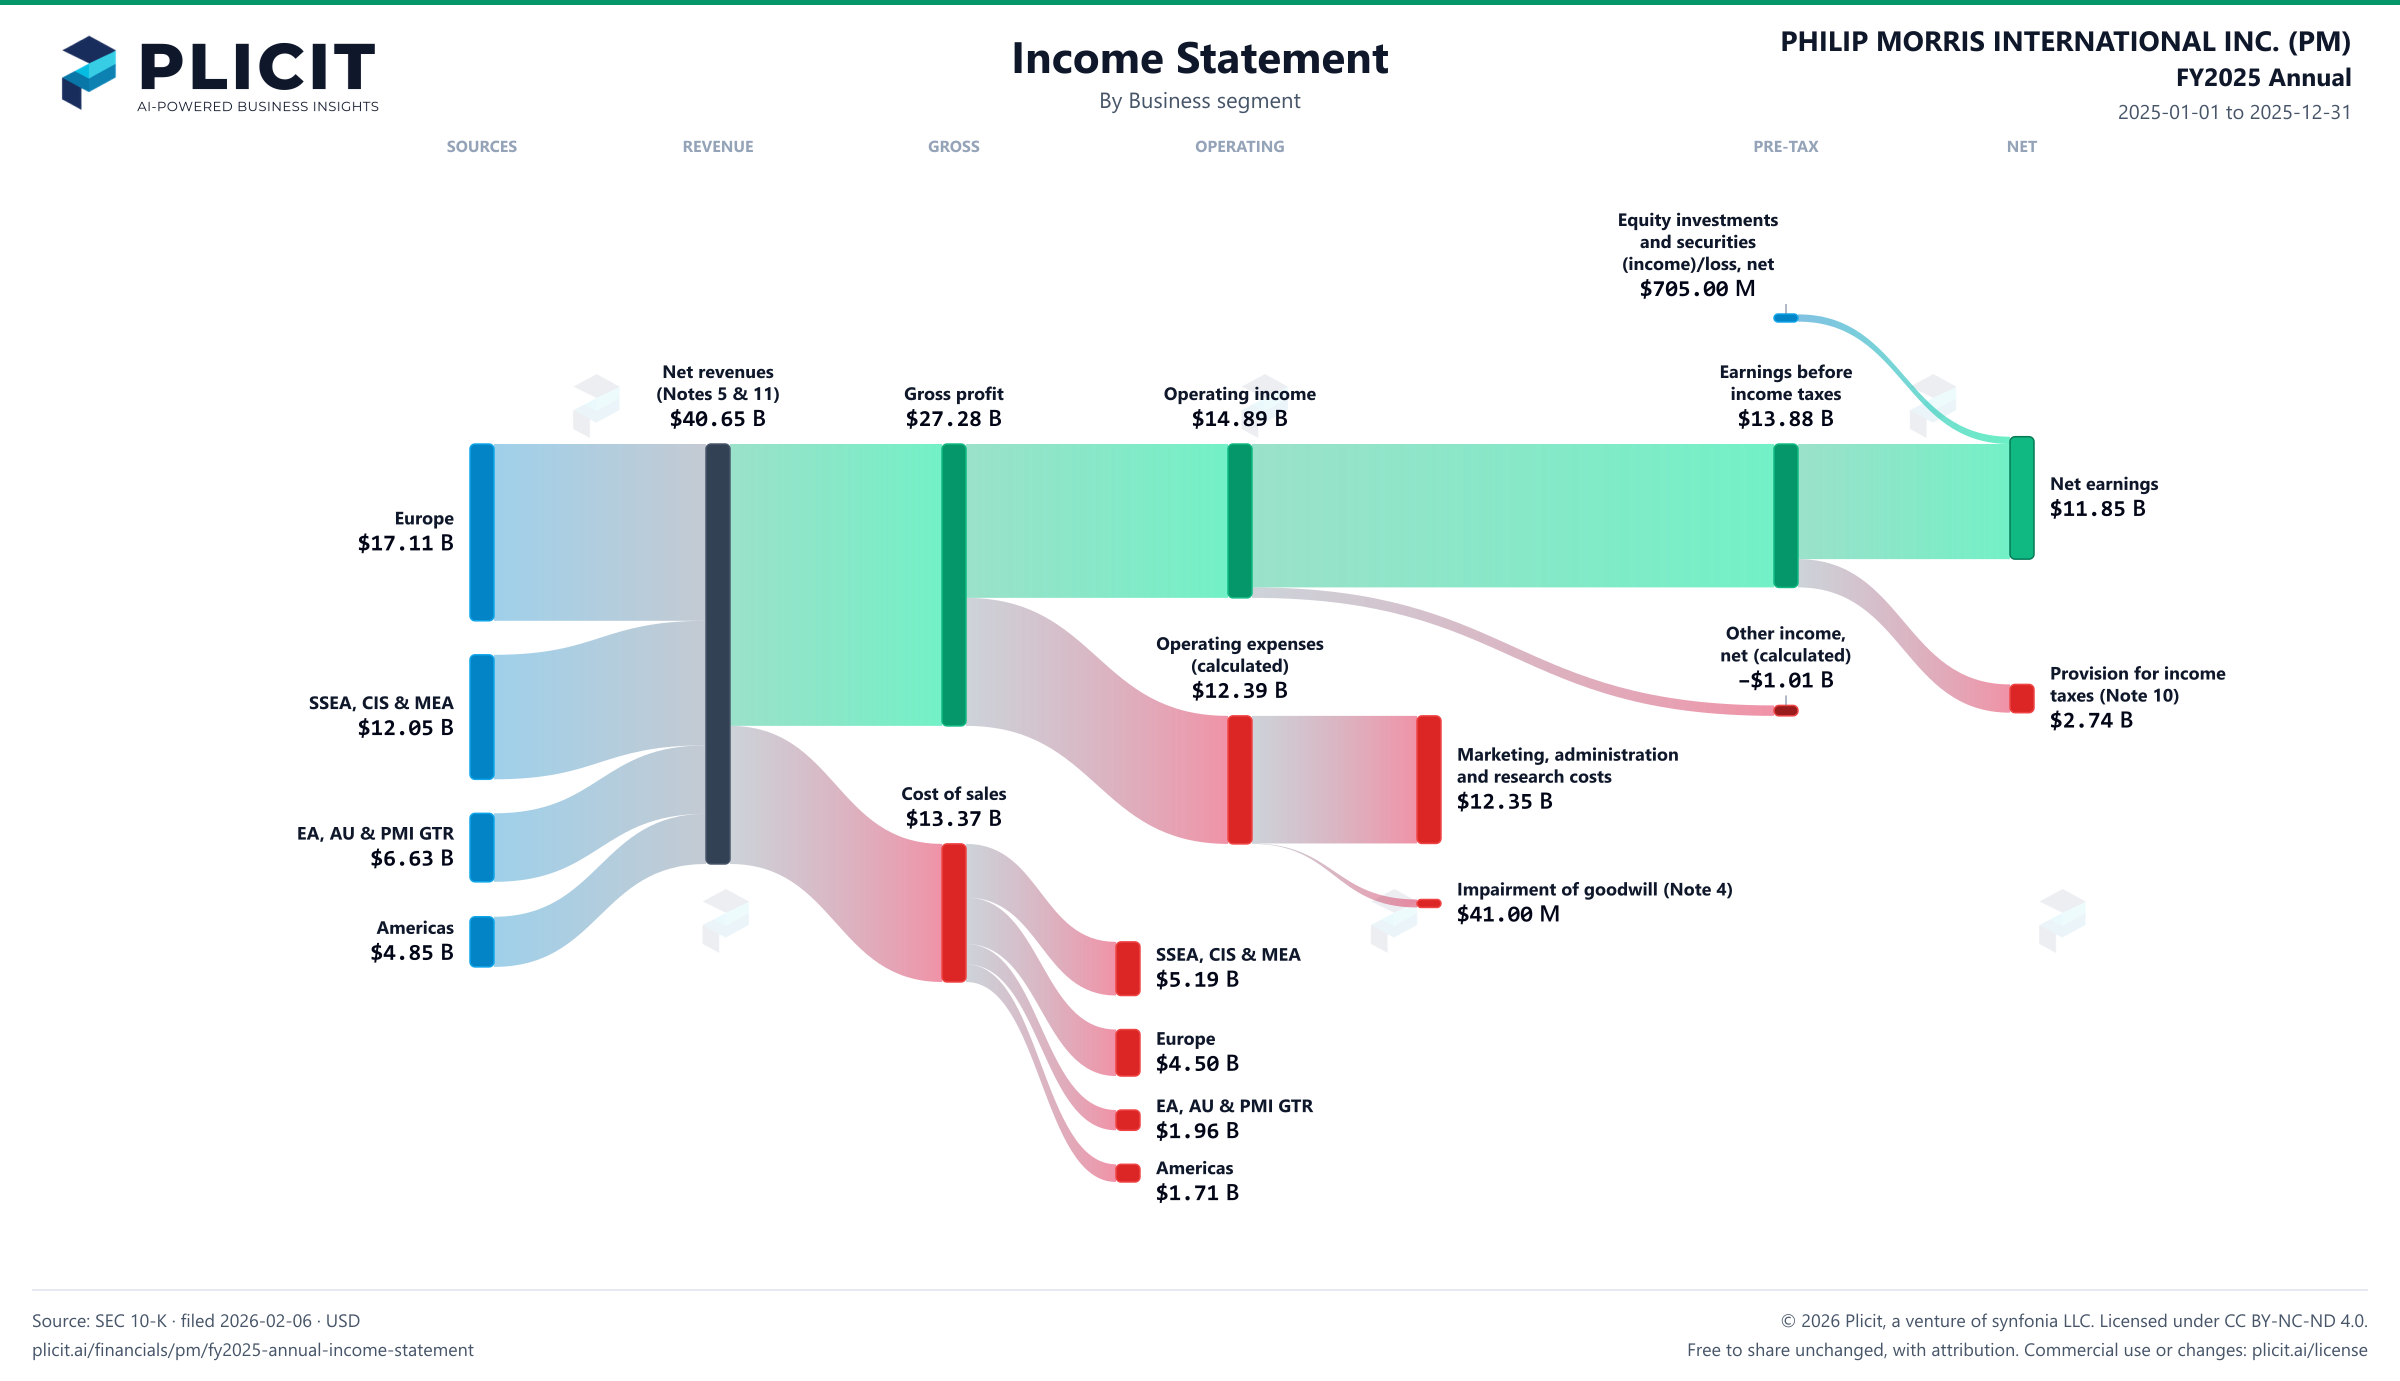
Income statement for 2025-01-01 through 2025-12-31. View: Business segment. Revenue and costs use their disclosed categories.
- Net revenues (Notes 5 & 11)
- 40,648,000,000 US dollars
- Cost of sales
- 13,366,000,000 US dollars
- Gross profit
- 27,282,000,000 US dollars
- Operating expenses (calculated)
- 12,390,000,000 US dollars
- Operating income
- 14,892,000,000 US dollars
- Other income (expense), net (calculated)
- negative 1,012,000,000 US dollars
- Earnings before income taxes
- 13,880,000,000 US dollars
- Provision for income taxes (Note 10)
- 2,737,000,000 US dollars
- Net earnings
- 11,848,000,000 US dollars
- SSEA, CIS & MEA Segment revenue
- 12,051,000,000 US dollars
- EA, AU & PMI GTR Segment revenue
- 6,632,000,000 US dollars
- Europe revenue
- 17,111,000,000 US dollars
- Americas revenue
- 4,854,000,000 US dollars
- SSEA, CIS & MEA Segment cost of revenue
- 5,190,000,000 US dollars
- EA, AU & PMI GTR Segment cost of revenue
- 1,961,000,000 US dollars
- Europe cost of revenue
- 4,501,000,000 US dollars
- Americas cost of revenue
- 1,714,000,000 US dollars
- Impairment of goodwill (Note 4)
- 41,000,000 US dollars
- Marketing, administration and research costs (Notes 3, 4, 11 & 18)
- 12,349,000,000 US dollars
- Impairment related to the RBH equity investment (Note 5)
- 0 US dollars. Reported below-tax contribution to net income.
- Equity investments and securities (income)/loss, net
- 705,000,000 US dollars. Reported below-tax contribution to net income.
Chart connections
- Revenue less cost of revenue equals gross profit; gross profit less operating expenses equals operating income.
- Operating income plus other income or expense equals income before tax. Income before tax less income tax expense or benefit, plus the explicitly reported below-tax contributions, equals net income.
- Of which attributable to PHILIP MORRIS INTERNATIONAL INC.: $11.35 B; to noncontrolling interests: $500.00 M.
Free to share unchanged, with credit to Plicit.ai · CC BY-NC-ND 4.0Download PNG
Gross margin
67.1%
Gross profit / revenue
Operating margin
36.6%
Operating profit / revenue
Cash conversion
103.2%
Operating cash / net income, same period
Product waitlist
Health Check and Teardown for your own company
A health check uncovers insights of your private books, not a public ticker. Join this list to get notified as soon as we go-live!