
Primerica, Inc. (PRI) FY2026 Q2 P&L / Income Statement

Revenue by Business Segment by Sales Channel

2026-04-01 to 2026-06-30

Swipe to see the full flow
Primerica, Inc. (PRI) FY2026 Q2 P&L / Income StatementIncome statement for 2026-04-01 through 2026-06-30. View: Segments by Contract with Customer, Sales Channel (Unaudited). Revenue uses this breakdown; costs and expenses retain the consolidated categories.SOURCESREVENUEOPERATINGPRE-TAXNETUndisclosed (calculated)Investment and Savings Products Segment - Total Segment Revenues from Contracts with CustomersCorporate and Other Distributed Products Segment - Total Segment Revenues from Contracts with CustomersTerm Life Insurance Segment - Total Segment Revenues from Contracts with CustomersTotal revenuesOperating profit (calculated)Total benefits and expensesSales commissionsBenefits and claimsAmortization of deferred policy acquisition costsInsurance expensesInterest expenseInsurance commissionsFuture policy benefits remeasurement (gain) lossOther operating expensesIncome before income taxesNet incomeIncome taxesOperating profit (calculated)Operating profit(calculated)$258.22 MTotal revenuesTotal revenues$865.07 MIncome before income taxesPretax income$258.22 MNet incomeNet income$202.28 MUndisclosed (calculated)Undisclosed (calculated)$493.75 MTotal benefits and expensesTotal benefitsand expenses$606.85 MIncome taxesIncome taxes$55.94 MSales commissionsSales commissions$201.92 MInvestment and Savings Products Segment - Total Segment Revenues from Contracts with CustomersInvestment and Savings ProductsSegment - Total Segment Revenuesfrom Contracts with Customers$347.68 MBenefits and claimsBenefits and claims$147.33 MCorporate and Other Distributed Products Segment - Total Segment Revenues from Contracts with CustomersCorporate and Other DistributedProducts… - Total Segment Revenuesfrom Contracts with Customers$12.40 MAmortization of deferred policy acquisition costsAmortization of deferredpolicy acquisition costs$85.13 MInsurance expensesInsurance expenses$71.16 MTerm Life Insurance Segment - Total Segment Revenues from Contracts with CustomersTerm Life Insurance Segment -Total Segment Revenues fromContracts with Customers$11.24 MInterest expenseInterest expense$5.83 MInsurance commissionsInsurance commissions$5.78 MFuture policy benefits remeasurement (gain) lossFuture policy benefitsremeasurement (gain) loss−$5.04 MOther operating expensesOther operating expenses$94.74 M
Chart details

Primerica, Inc. (PRI) FY2026 Q2 P&L / Income Statement

Income statement for 2026-04-01 through 2026-06-30. View: Segments by Contract with Customer, Sales Channel (Unaudited). Revenue uses this breakdown; costs and expenses retain the consolidated categories.

Total revenues
865,067,000 US dollars
Total benefits and expenses
606,848,000 US dollars
Operating profit (calculated)
258,219,000 US dollars
Other income (expense), net (calculated)
0 US dollars
Income before income taxes
258,219,000 US dollars
Income taxes
55,941,000 US dollars
Net income
202,278,000 US dollars
Investment and Savings Products Segment - Total Segment Revenues from Contracts with Customers
347,675,000 US dollars
Term Life Insurance Segment - Total Segment Revenues from Contracts with Customers
11,243,000 US dollars
Corporate and Other Distributed Products Segment - Total Segment Revenues from Contracts with Customers
12,403,000 US dollars
Undisclosed (calculated)
493,746,000 US dollars
Benefits and claims
147,328,000 US dollars
Future policy benefits remeasurement (gain) loss
negative 5,038,000 US dollars
Amortization of deferred policy acquisition costs
85,128,000 US dollars
Sales commissions
201,924,000 US dollars
Insurance expenses
71,159,000 US dollars
Insurance commissions
5,778,000 US dollars
Interest expense
5,833,000 US dollars
Other operating expenses
94,736,000 US dollars

Chart connections

  • Revenue minus operating expenses equals operating income.
  • Operating income plus other income or expense equals income before tax. Income before tax less income tax expense or benefit equals net income.
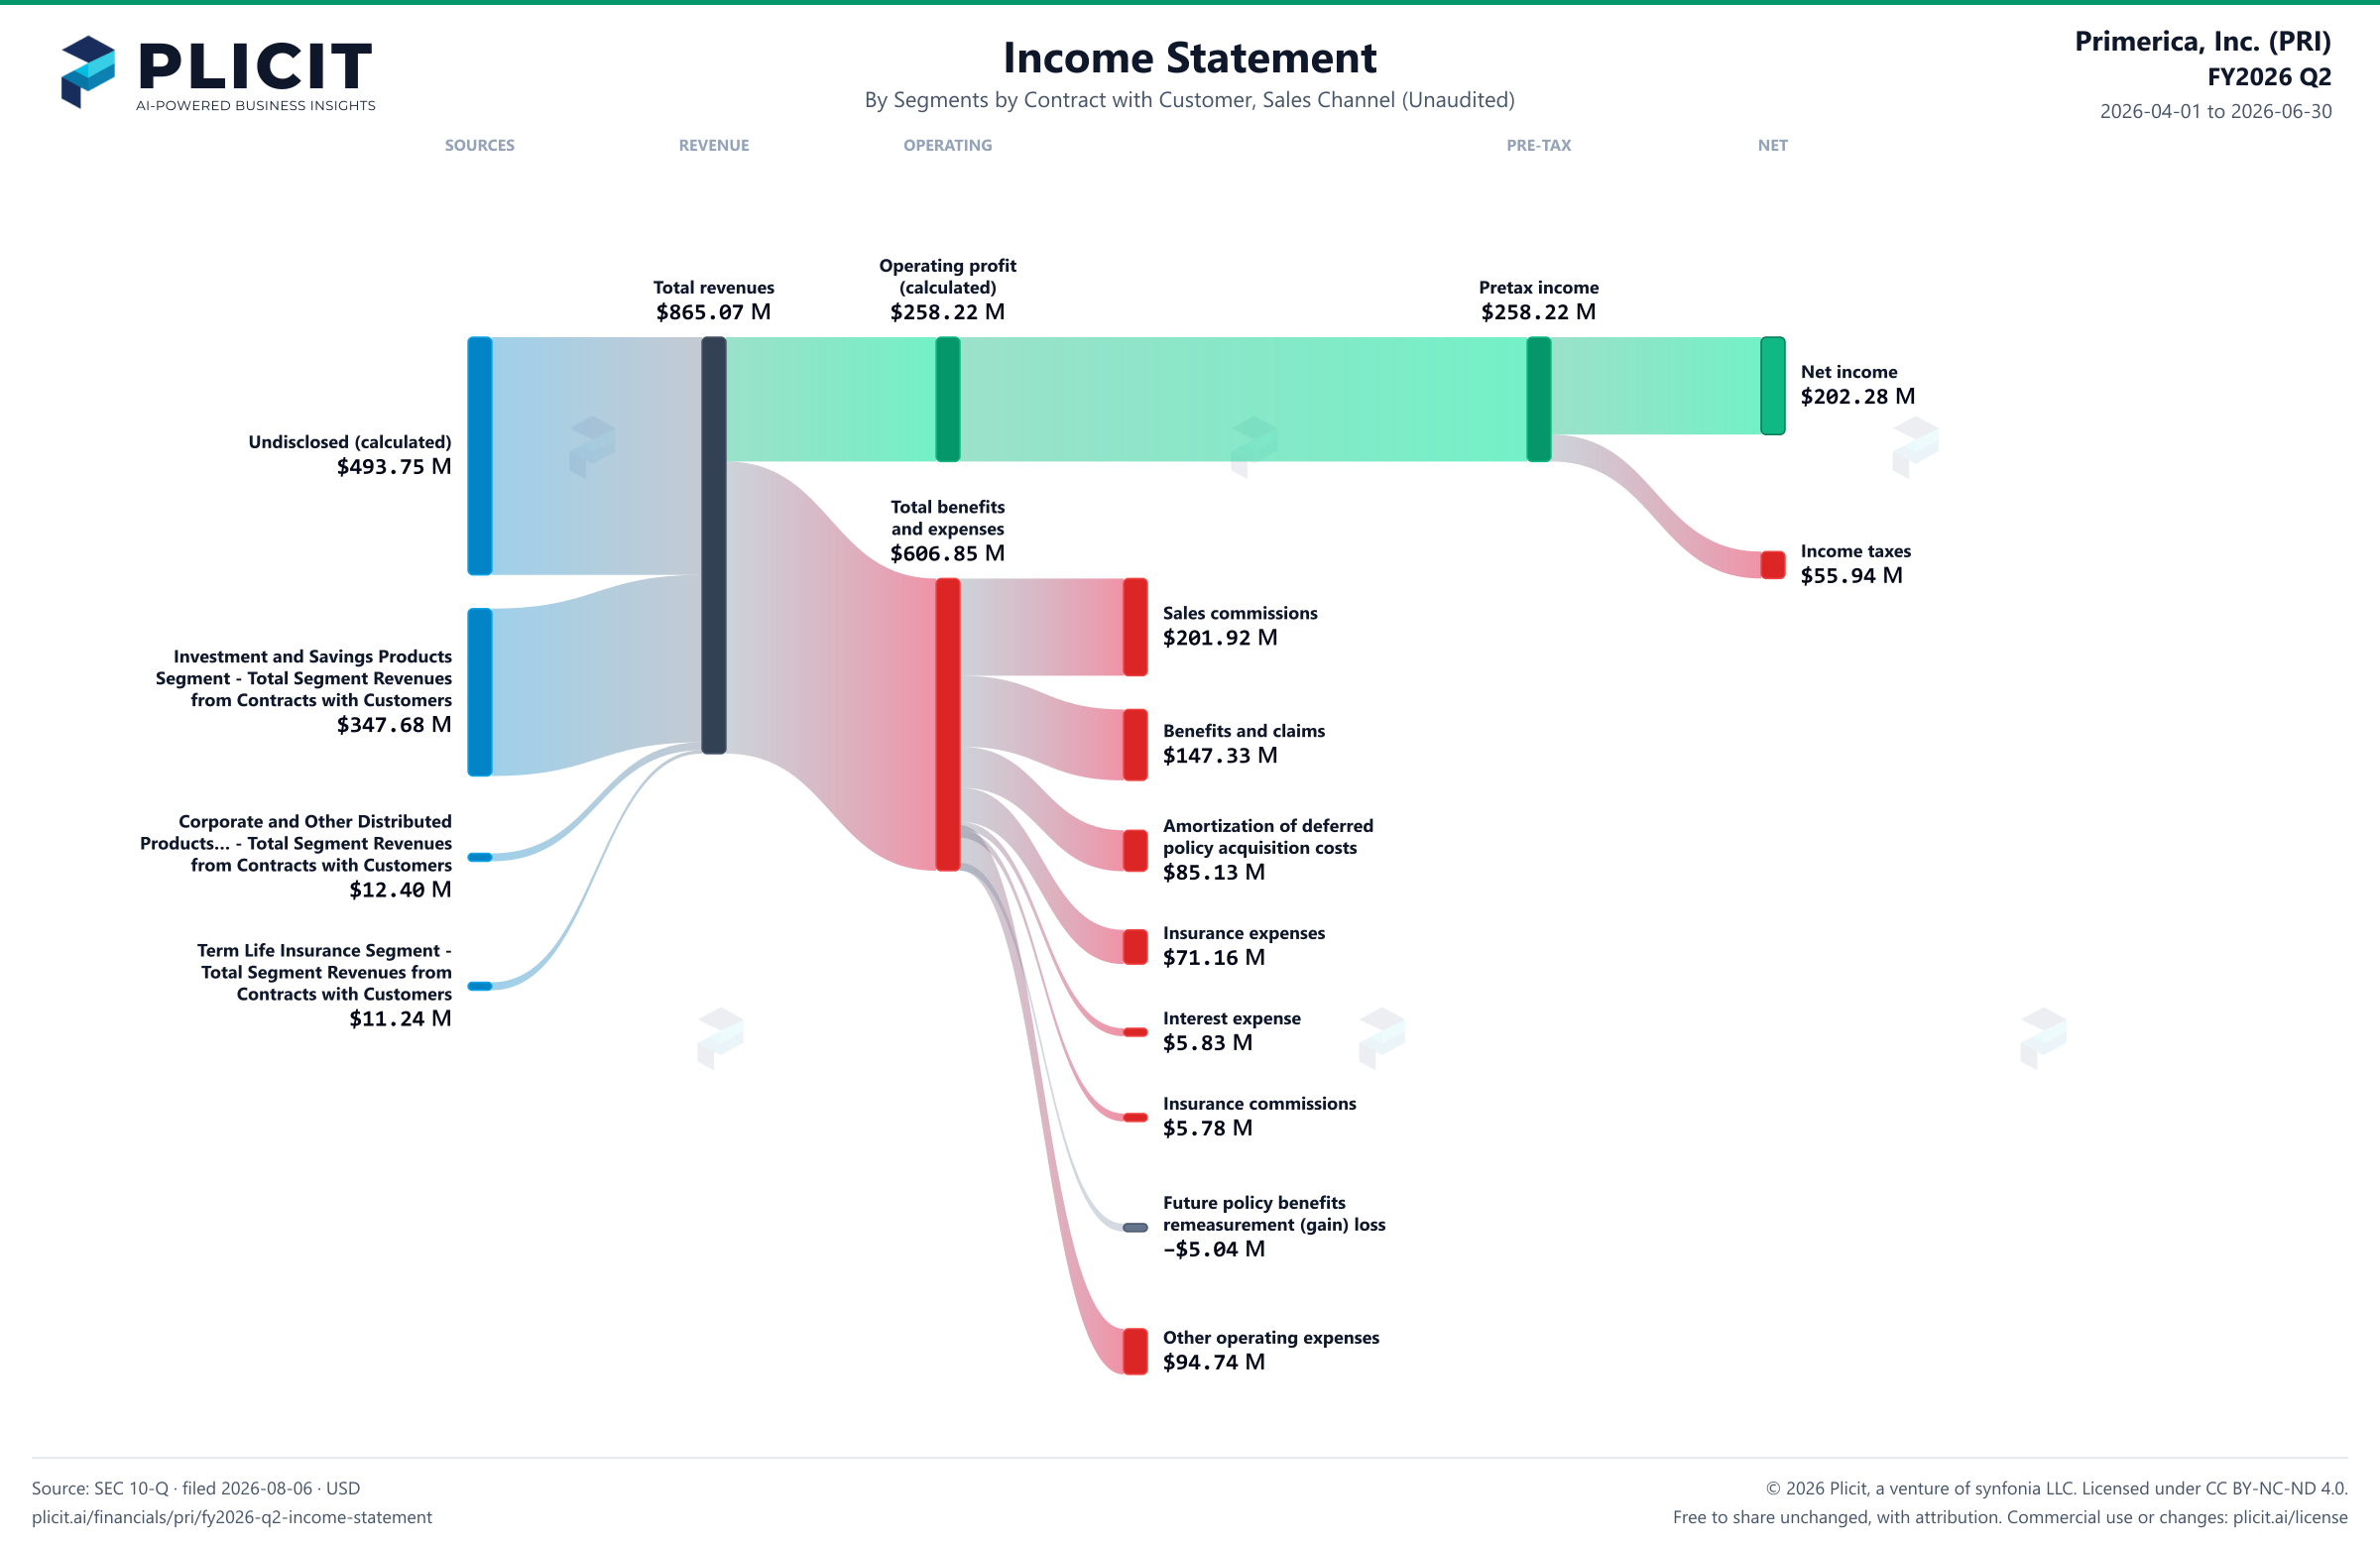
Primerica, Inc. (PRI) FY2026 Q2 Revenue by Business Segment by Sales Channel Sankey chart
Free to share unchanged, with credit to Plicit.ai · CC BY-NC-ND 4.0Download PNG

Operating margin

29.8%

Operating profit / revenue

Cash conversion

95.8%

Operating cash / net income, same period

Newsletter

Get the teardowns by email

Subscribe if you want the public-company teardowns in your inbox when they're released.

Product waitlist

Health Check and Teardown for your own company

A health check uncovers insights of your private books, not a public ticker. Join this list to get notified as soon as we go-live!