
Prudential Financial, Inc. (PRU) FY2024 Annual P&L / Income Statement

Revenue by Product and Service

2024-01-01 to 2024-12-31

Swipe to see the full flow
Prudential Financial, Inc. (PRU) FY2024 Annual P&L / Income StatementIncome statement for 2024-01-01 through 2024-12-31. View: Revenue categories. Revenue uses this breakdown; costs and expenses retain the consolidated categories.SOURCESREVENUE RECONCILIATIONREVENUEOPERATINGPRE-TAXNETPremiums (includes $73, $323 and $(377) of gains (losses) from changes in estimates on deferred profit liability amortization for the year ended December 31, 2024, 2023 and 2022, respectively)Net investment incomePolicy charges and fee incomeAsset management and service feesOther income (loss)Total revenuesRevenue before reconciliation (calculated)Realized investment gains (losses), netChange in value of market risk benefits, net of related hedging gains (losses)Operating profit (calculated)Total benefits and expensesPolicyholders’ benefitsGeneral and administrative expensesInterest credited to policyholders’ account balancesAmortization of deferred policy acquisition costsDividends to policyholdersChange in estimates of liability for future policy benefitsINCOME (LOSS) BEFORE INCOME TAXES AND EQUITY IN EARNINGS OF JOINT VENTURES AND OTHER OPERATING ENTITIESNET INCOME (LOSS)Total income tax expense (benefit)Equity in earnings of joint ventures and other operating entities, net of taxesEquity in earnings of joint ventures and other operating entities, net of taxesEquity in earnings ofjoint ventures andother operating…$144.00 MRevenue before reconciliation (calculated)Revenue beforereconciliation(calculated)$74.23 BOperating profit (calculated)Operating profit(calculated)$3.21 BTotal revenuesTotal revenues$70.41 BINCOME (LOSS) BEFORE INCOME TAXES AND EQUITY IN EARNINGS OF JOINT VENTURES AND OTHER OPERATING ENTITIESPretax income$3.21 BNET INCOME (LOSS)NET INCOME (LOSS)$2.85 BTotal benefits and expensesTotal benefitsand expenses$67.20 BPremiums (includes $73, $323 and $(377) of gains (losses) from changes in estimates on deferred profit liability amortization for the year ended December 31, 2024, 2023 and 2022, respectively)Premiums$42.90 BTotal income tax expense (benefit)Total income taxexpense (benefit)$507.00 MPolicyholders’ benefitsPolicyholders’ benefits$47.12 BNet investment incomeNet investment income$19.91 BPolicy charges and fee incomePolicy charges and fee income$4.30 BGeneral and administrative expensesGeneral andadministrative expenses$13.34 BAsset management and service feesAsset management and service fees$4.09 BInterest credited to policyholders’ account balancesInterest credited topolicyholders’ account balances$4.58 BRealized investment gains (losses), netRealized investmentgains (losses), net−$3.43 BOther income (loss)Other income (loss)$3.04 BAmortization of deferred policy acquisition costsAmortization of deferredpolicy acquisition costs$1.49 BChange in value of market risk benefits, net of related hedging gains (losses)Change in valueof market riskbenefits, net−$397.00 MDividends to policyholdersDividends to policyholders$698.00 MChange in estimates of liability for future policy benefitsChange in estimates of liabilityfor future policy benefits−$37.00 M
Chart details

Prudential Financial, Inc. (PRU) FY2024 Annual P&L / Income Statement

Income statement for 2024-01-01 through 2024-12-31. View: Revenue categories. Revenue uses this breakdown; costs and expenses retain the consolidated categories.

Total revenues
70,405,000,000 US dollars
Total benefits and expenses
67,196,000,000 US dollars
Operating profit (calculated)
3,209,000,000 US dollars
Other income (expense), net (calculated)
0 US dollars
INCOME (LOSS) BEFORE INCOME TAXES AND EQUITY IN EARNINGS OF JOINT VENTURES AND OTHER OPERATING ENTITIES
3,209,000,000 US dollars
Total income tax expense (benefit)
507,000,000 US dollars
NET INCOME (LOSS)
2,846,000,000 US dollars
Premiums (includes $73, $323 and $(377) of gains (losses) from changes in estimates on deferred profit liability amortization for the year ended December 31, 2024, 2023 and 2022, respectively)
42,897,000,000 US dollars
Policy charges and fee income
4,298,000,000 US dollars
Net investment income
19,909,000,000 US dollars
Asset management and service fees
4,090,000,000 US dollars
Other income (loss)
3,037,000,000 US dollars
Policyholders’ benefits
47,119,000,000 US dollars
Change in estimates of liability for future policy benefits
negative 37,000,000 US dollars
Interest credited to policyholders’ account balances
4,582,000,000 US dollars
Dividends to policyholders
698,000,000 US dollars
Amortization of deferred policy acquisition costs
1,492,000,000 US dollars
Goodwill impairment
0 US dollars
General and administrative expenses
13,342,000,000 US dollars
Revenue before reconciliation (calculated)
74,231,000,000 US dollars. Sum of the reported revenue categories before the separately reported reconciliation.
Realized investment gains (losses), net
negative 3,429,000,000 US dollars. Reported reconciliation to consolidated revenue.
Change in value of market risk benefits, net of related hedging gains (losses)
negative 397,000,000 US dollars. Reported reconciliation to consolidated revenue.
Equity in earnings of joint ventures and other operating entities, net of taxes
144,000,000 US dollars. Reported below-tax contribution to net income.

Chart connections

  • Revenue minus operating expenses equals operating income.
  • Operating income plus other income or expense equals income before tax. Income before tax less income tax expense or benefit, plus the explicitly reported below-tax contributions, equals net income.
  • Reported revenue categories plus the separately reported signed reconciliation equals consolidated revenue.
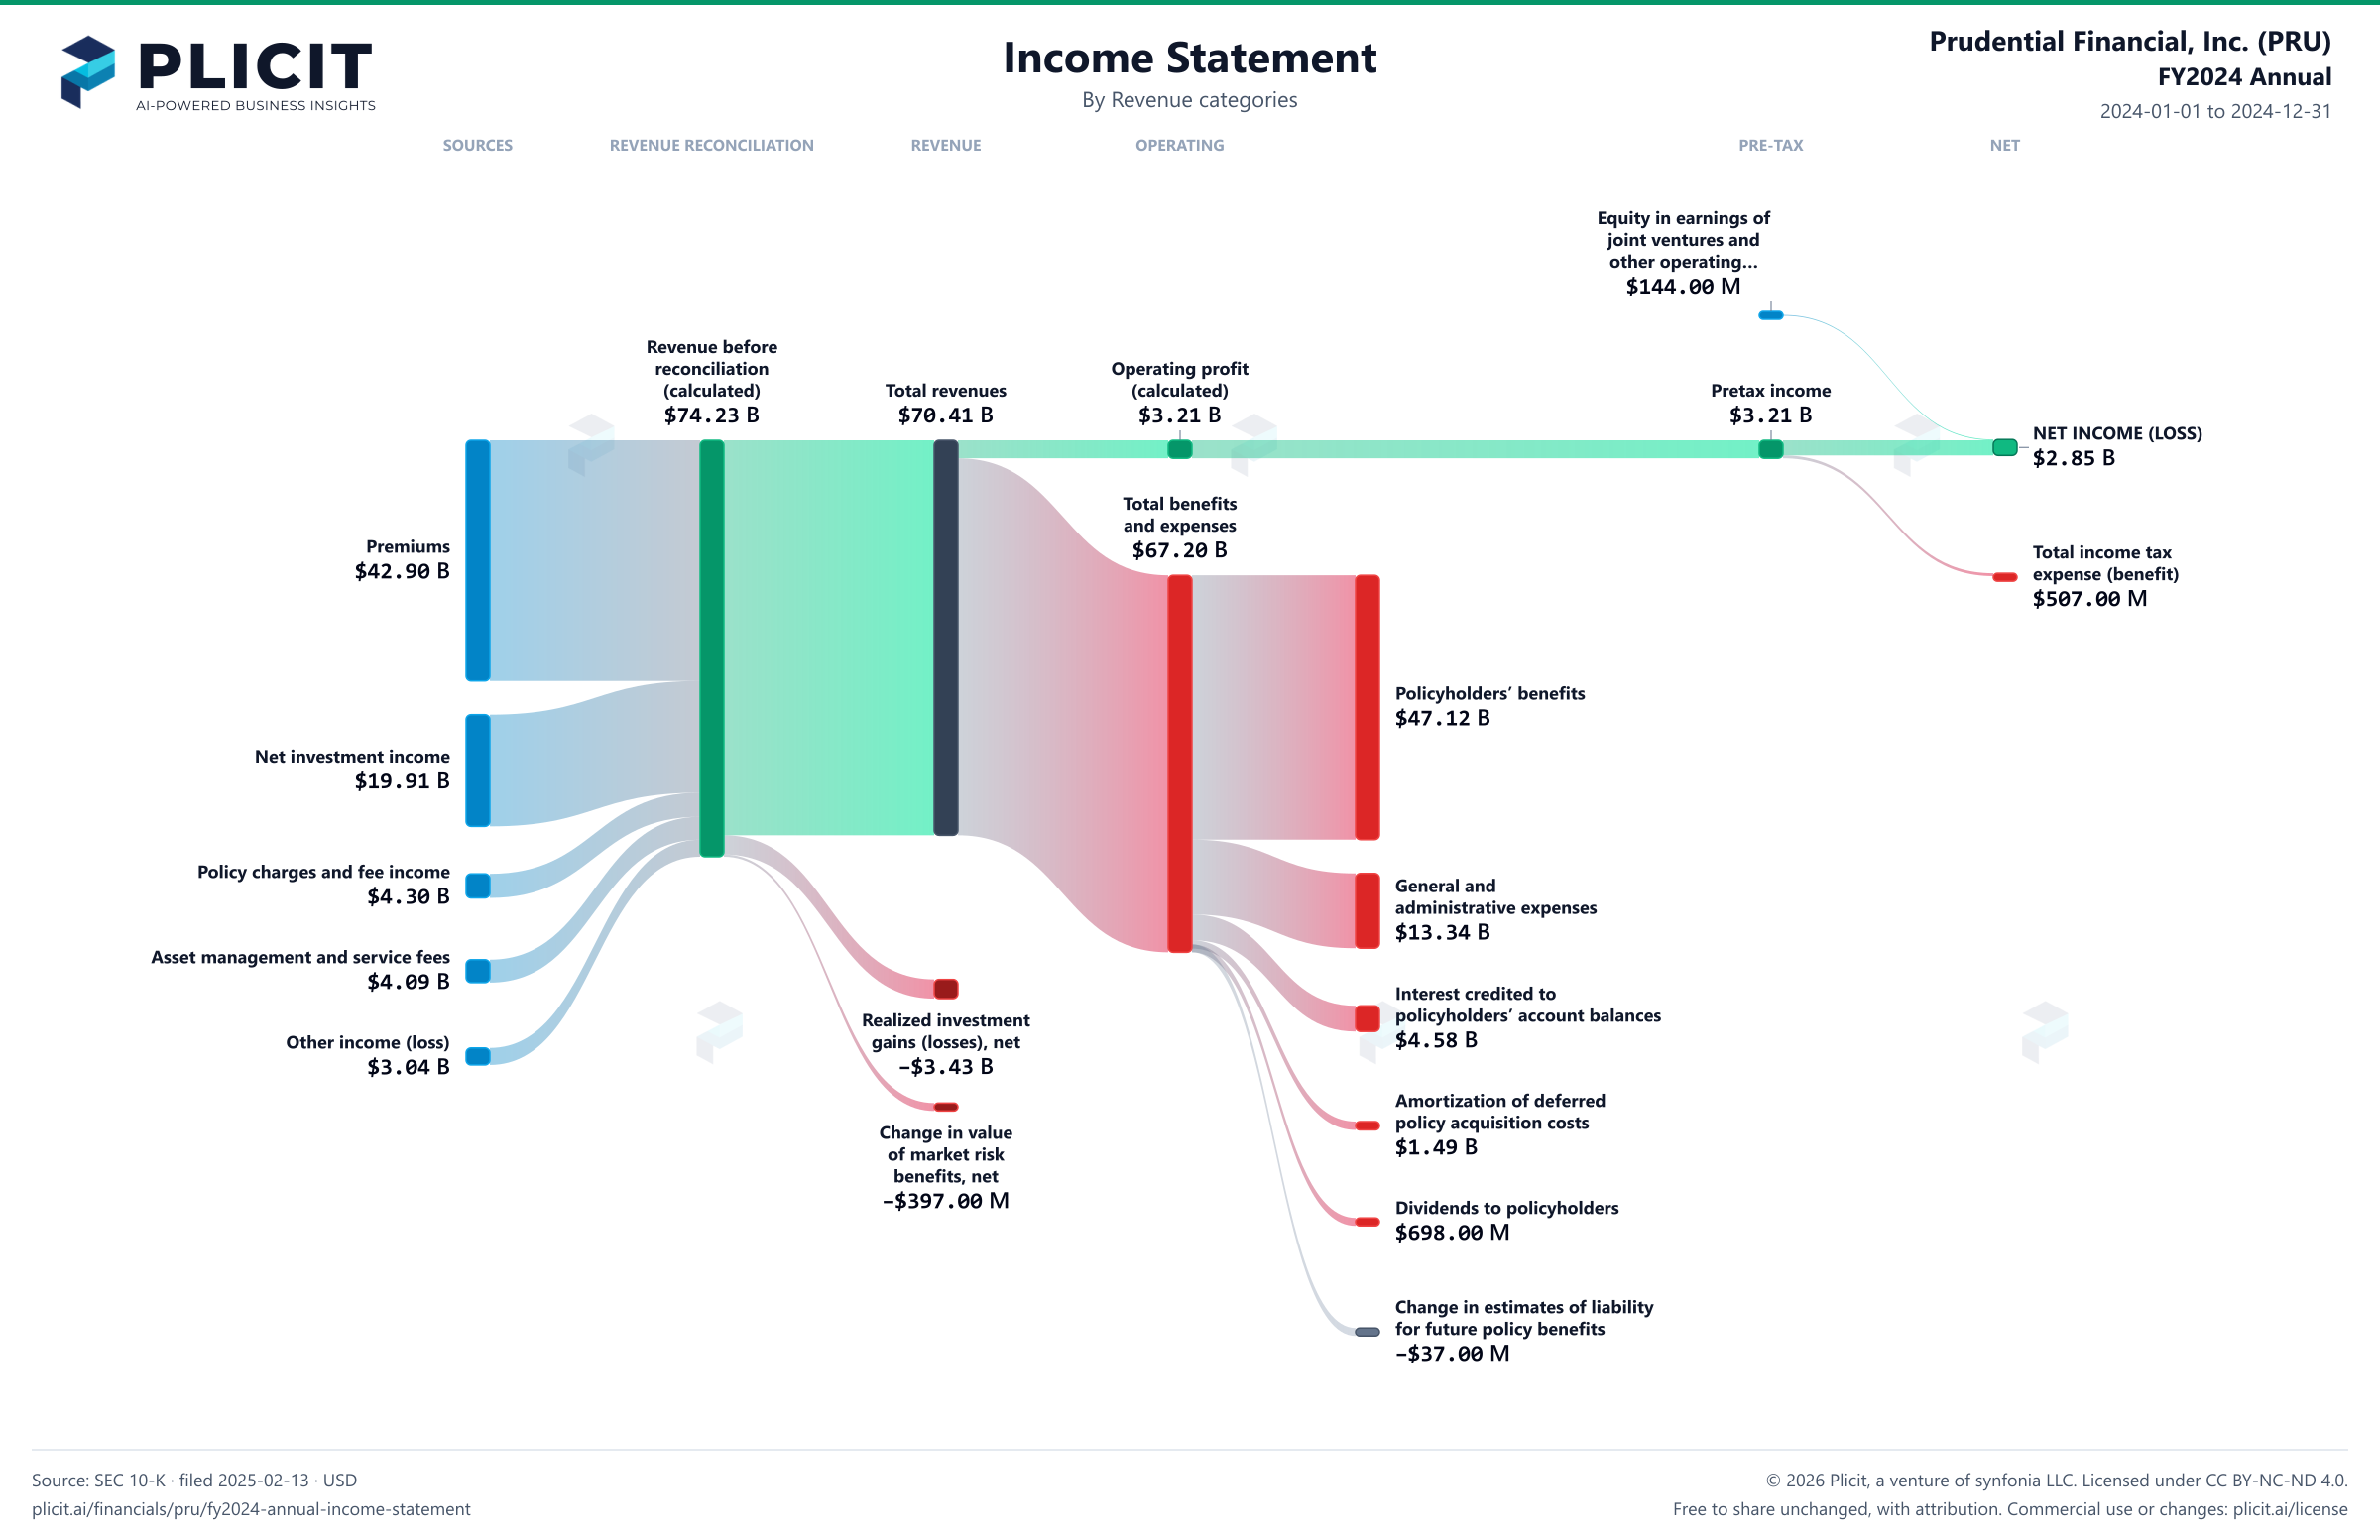
Prudential Financial, Inc. (PRU) FY2024 Annual P&L / Income Statement Sankey chart, Product and service view
Free to share unchanged, with credit to Plicit.ai · CC BY-NC-ND 4.0Download PNG

Operating margin

4.6%

Operating profit / revenue

Cash conversion

298.7%

Operating cash / net income, same period

Newsletter

Get the teardowns by email

Subscribe if you want the public-company teardowns in your inbox when they're released.

Product waitlist

Health Check and Teardown for your own company

A health check uncovers insights of your private books, not a public ticker. Join this list to get notified as soon as we go-live!