
Prudential Financial, Inc. (PRU) FY2024 Annual Balance Sheet
As of 2024-12-31
Balance Sheet
As of 2024-12-31
Swipe to see the full flow
Chart details
Prudential Financial, Inc. (PRU) FY2024 Annual Balance Sheet
Balance sheet as of 2024-12-31. The chart shows assets, liabilities and equity at that date.
- Assets
- 735,587,000,000 US dollars
- Liabilities
- 705,461,000,000 US dollars
- Equity
- 28,187,000,000 US dollars
- Redeemable noncontrolling interests
- 1,939,000,000 US dollars
- Noncontrolling interest
- 315,000,000 US dollars. Included in consolidated equity; this amount is not added again.
- Fixed maturities, available-for-sale, at fair value (allowance for credit losses: 2024-$331; 2023-$160) (amortized cost: 2024-$341,004; 2023-$334,598)
- 311,570,000,000 US dollars
- Separate account assets
- 193,372,000,000 US dollars
- Total net loans
- 62,341,000,000 US dollars
- Reinsurance recoverables and deposit receivables (net of $12 and $12 allowance for credit losses; includes $849 and $149 of embedded derivatives at fair value at December 31, 2024 and 2023, respectively)
- 37,680,000,000 US dollars
- Other invested assets (net of $2 and $1 allowance for credit losses; includes $7,573 and $6,074 of assets measured at fair value at December 31, 2024 and 2023, respectively)
- 26,351,000,000 US dollars
- Deferred policy acquisition cost
- 20,448,000,000 US dollars
- Cash and cash equivalents
- 18,497,000,000 US dollars
- Other assets (net of $2 and $3 allowance for credit losses; includes $0 and $11 of assets at fair value at December 31, 2024 and 2023, respectively)
- 13,737,000,000 US dollars
- Fixed maturities, trading, at fair value (amortized cost: 2024-$13,631; 2023-$10,624)
- 12,530,000,000 US dollars
- Policy loans
- 9,795,000,000 US dollars
- Equity securities, at fair value (cost: 2024-$7,043; 2023-$5,786)
- 9,417,000,000 US dollars
- Short-term investments (net of allowance for credit losses: 2024-$0; 2023-$0)
- 9,069,000,000 US dollars
- Assets supporting experience-rated contractholder liabilities, at fair value
- 3,707,000,000 US dollars
- Accrued investment income
- 3,441,000,000 US dollars
- Market risk benefit assets
- 2,331,000,000 US dollars
- Income Tax Assets
- 866,000,000 US dollars
- Value of business acquired
- 435,000,000 US dollars
- Future policy benefits
- 268,912,000,000 US dollars
- Separate account liabilities
- 193,372,000,000 US dollars
- Policyholders' account balances
- 166,254,000,000 US dollars
- Long-term debt
- 19,187,000,000 US dollars
- Reinsurance and funds withheld payables (includes $(118) and $490 of embedded derivatives at fair value at December 31, 2024 and 2023, respectively)
- 17,084,000,000 US dollars
- Other liabilities (includes $14 and $15 allowance for credit losses and $4,751 and $4,175 of derivatives at fair value at December 31, 2024 and 2023, respectively)
- 16,679,000,000 US dollars
- Cash collateral for loaned securities
- 9,621,000,000 US dollars
- Securities sold under agreements to repurchase
- 6,796,000,000 US dollars
- Market risk benefit liabilities
- 4,455,000,000 US dollars
- Notes issued by consolidated variable interest entities (includes $60 and $778 measured at fair value under the fair value option at December 31, 2024 and 2023, respectively)
- 1,430,000,000 US dollars
- Short-term debt
- 953,000,000 US dollars
- Policyholder's dividends
- 718,000,000 US dollars
- Retained Earnings
- 33,187,000,000 US dollars
- Additional paid-in capital
- 25,901,000,000 US dollars
- Common Stock ($0.01 par value; 1,500,000,000 shares authorized; 666,305,189 shares issued as of both December 31, 2024 and 2023)
- 6,000,000 US dollars
- Preferred Stock ($0.01 par value; 10,000,000 shares authorized; none issued)
- 0 US dollars
- Noncontrolling Interests
- 315,000,000 US dollars
- Common Stock held in treasury, at cost (311,738,187 and 307,089,216 shares at December 31, 2024 and 2023, respectively)
- negative 24,511,000,000 US dollars
- Accumulated other comprehensive income (loss)
- negative 6,711,000,000 US dollars
- Gross equity (calculated)
- 59,409,000,000 US dollars. Net equity plus the magnitudes of its negative contributions equals gross positive equity. The negative contributions enter this reconciliation as add-backs; their filed signs stay negative.
Chart connections
- Assets equal liabilities plus temporary equity plus consolidated equity. Consolidated equity includes noncontrolling interests when reported.
- Treasury shares and other negative equity contributions reduce equity.
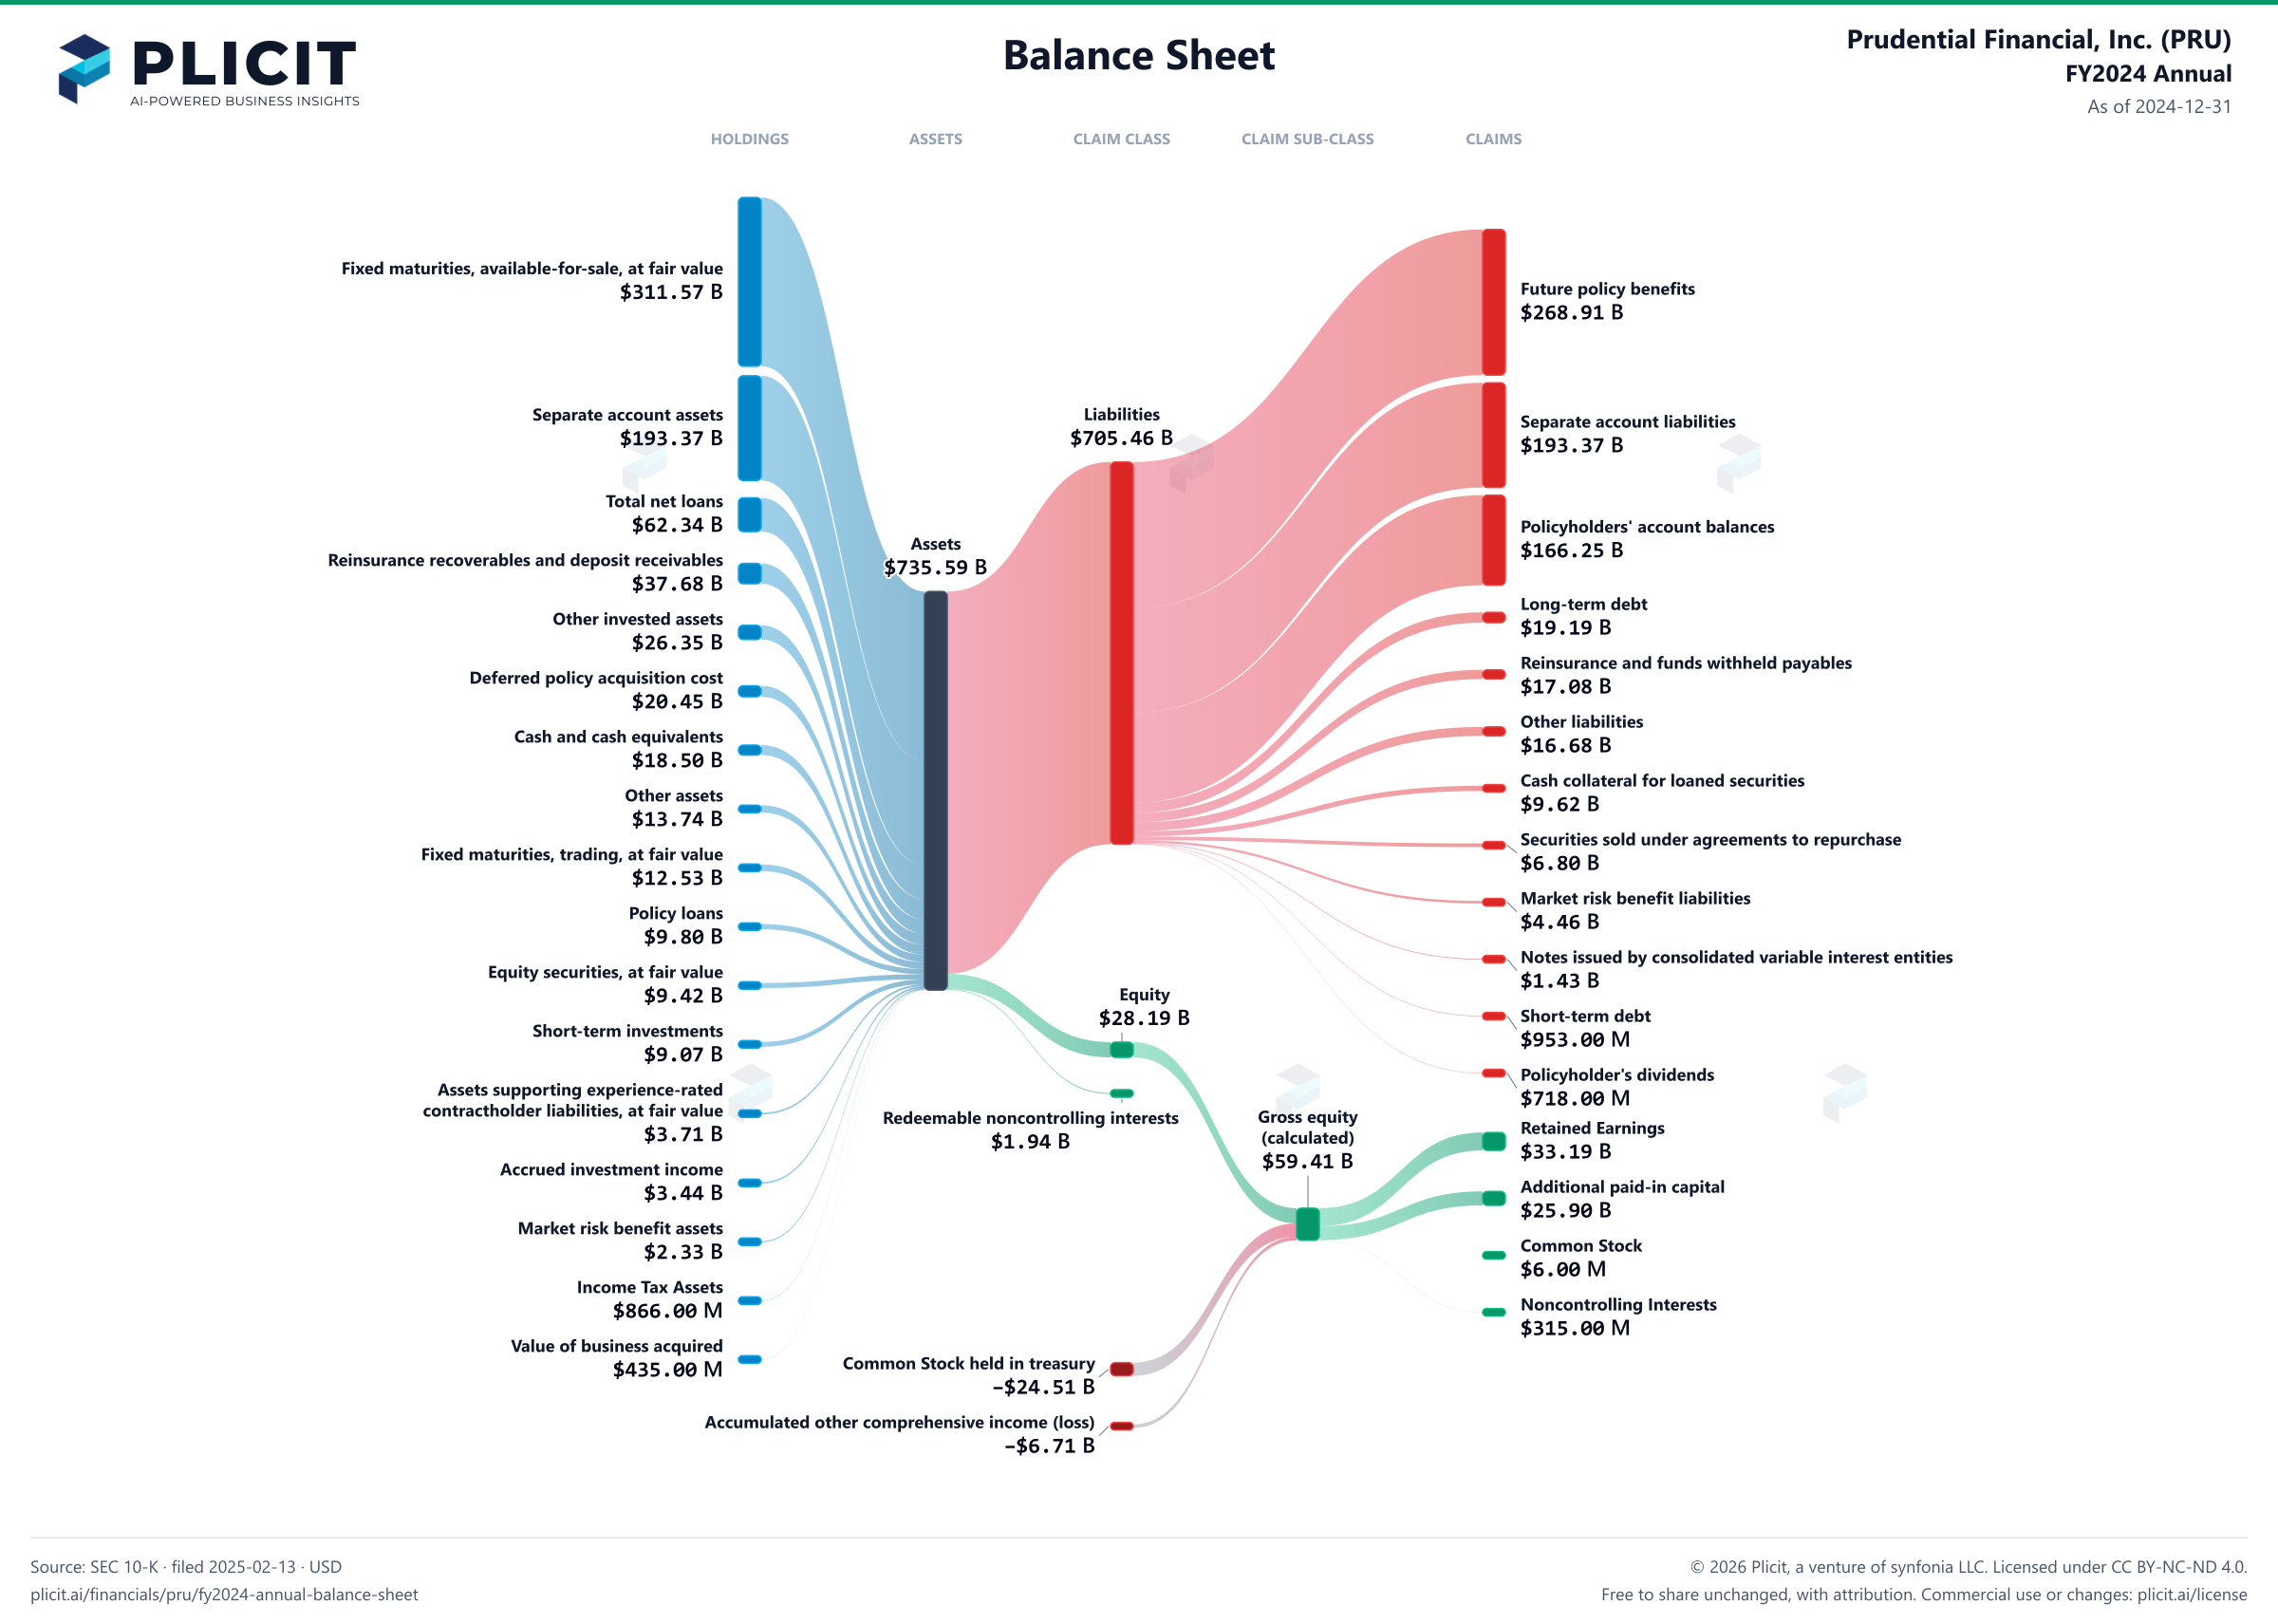
Free to share unchanged, with credit to Plicit.ai · CC BY-NC-ND 4.0Download PNG
Product waitlist
Health Check and Teardown for your own company
A health check uncovers insights of your private books, not a public ticker. Join this list to get notified as soon as we go-live!