
Prudential Financial, Inc. (PRU) FY2025 Annual Balance Sheet

Balance Sheet

As of 2025-12-31

Swipe to see the full flow
Prudential Financial, Inc. (PRU) FY2025 Annual Balance SheetBalance sheet as of 2025-12-31. The chart shows assets, liabilities and equity at that date.Liabilities$738.16 BAssets$773.74 BEquity$32.79 BRedeemable noncontrolling interests$2.79 BGross equity(calculated)$61.20 BHOLDINGSASSETSCLAIM CLASSCLAIM SUB-CLASSCLAIMSFixed maturities, available-for-sale, at fair value (allowance for credit losses: 2025-$183; 2024-$331) (amortized cost: 2025-$357,996; 2024-$341,004)Separate account assetsCommercial mortgage and other loans (net of $469 and $574 allowance for credit losses; includes $1,056 and $702 of loans measured at fair value under the fair value option at December 31, 2025 and 2024, respectively)Reinsurance recoverables and deposit receivables (net of $14 and $12 allowance for credit losses; includes $573 and $849 of embedded derivatives at fair value at December 31, 2025 and 2024, respectively)Other invested assets (net of $2 and $2 allowance for credit losses; includes $8,285 and $7,574 of assets measured at fair value at December 31, 2025 and 2024, respectively)Deferred policy acquisition costCash and cash equivalentsOther assets (net of $1 and $2 allowance for credit losses; includes $0 and $0 of assets at fair value at December 31, 2025 and 2024, respectively)Fixed maturities, trading, at fair value (amortized cost: 2025-$15,536; 2024-$13,631)Equity securities, at fair value (cost: 2025-$8,303; 2024-$7,043)Policy loansShort-term investments (net of allowance for credit losses: 2025-$0; 2024-$0)Assets supporting experience-rated contractholder liabilities, at fair valueAccrued investment incomeMarket risk benefit assetsValue of business acquiredIncome Tax AssetsFuture policy benefitsSeparate account liabilitiesPolicyholders' account balancesLong-term debtReinsurance and funds withheld payables (includes $174 and $(118) of embedded derivatives at fair value at December 31, 2025 and 2024, respectively)Other liabilities (includes $16 and $14 allowance for credit losses and $6,215 and $4,751 of derivatives at fair value at December 31, 2025 and 2024, respectively)Securities sold under agreements to repurchaseCash collateral for loaned securitiesMarket risk benefit liabilitiesNotes issued by consolidated variable interest entities (includes $767 and $60 measured at fair value under the fair value option at December 31, 2025 and 2024, respectively)Short-term debtPolicyholder's dividendsRetained EarningsAdditional paid-in capitalCommon Stock ($0.01 par value; 1,500,000,000 shares authorized; 666,305,189 shares issued as of both December 31, 2025 and 2024)Noncontrolling InterestsAssetsLiabilitiesEquityGross equity (calculated)Common Stock held in treasury, at cost (318,361,498 and 311,738,187 shares at December 31, 2025 and 2024, respectively)Accumulated other comprehensive income (loss)Redeemable noncontrolling interestsFixed maturities, available-for-sale, at fair value (allowance for credit losses: 2025-$183; 2024-$331) (amortized cost: 2025-$357,996; 2024-$341,004)Fixed maturities, available-for-sale, at fair value$331.46 BFuture policy benefitsFuture policy benefits$266.91 BSeparate account liabilitiesSeparate account liabilities$196.25 BLiabilitiesLiabilities$738.16 BSeparate account assetsSeparate account assets$196.25 BCommercial mortgage and other loans (net of $469 and $574 allowance for credit losses; includes $1,056 and $702 of loans measured at fair value under the fair value option at December 31, 2025 and 2024, respectively)Commercial mortgage and other loans$64.72 BPolicyholders' account balancesPolicyholders' account balances$191.31 BAssetsAssets$773.74 BReinsurance recoverables and deposit receivables (net of $14 and $12 allowance for credit losses; includes $573 and $849 of embedded derivatives at fair value at December 31, 2025 and 2024, respectively)Reinsurance recoverables and deposit receivables$44.08 BLong-term debtLong-term debt$18.86 BOther invested assets (net of $2 and $2 allowance for credit losses; includes $8,285 and $7,574 of assets measured at fair value at December 31, 2025 and 2024, respectively)Other invested assets$27.29 BReinsurance and funds withheld payables (includes $174 and $(118) of embedded derivatives at fair value at December 31, 2025 and 2024, respectively)Reinsurance and funds withheld payables$18.84 BDeferred policy acquisition costDeferred policy acquisition cost$21.53 BOther liabilities (includes $16 and $14 allowance for credit losses and $6,215 and $4,751 of derivatives at fair value at December 31, 2025 and 2024, respectively)Other liabilities$17.69 BCash and cash equivalentsCash and cash equivalents$19.71 BSecurities sold under agreements to repurchaseSecurities sold under agreements to repurchase$9.60 BOther assets (net of $1 and $2 allowance for credit losses; includes $0 and $0 of assets at fair value at December 31, 2025 and 2024, respectively)Other assets$15.01 BCash collateral for loaned securitiesCash collateral for loaned securities$8.70 BFixed maturities, trading, at fair value (amortized cost: 2025-$15,536; 2024-$13,631)Fixed maturities, trading, at fair value$14.87 BMarket risk benefit liabilitiesMarket risk benefit liabilities$4.62 BEquity securities, at fair value (cost: 2025-$8,303; 2024-$7,043)Equity securities, at fair value$10.97 BNotes issued by consolidated variable interest entities (includes $767 and $60 measured at fair value under the fair value option at December 31, 2025 and 2024, respectively)Notes issued by consolidated variable interest entities$2.66 BPolicy loansPolicy loans$9.96 BEquityEquity$32.79 BShort-term debtShort-term debt$1.44 BShort-term investments (net of allowance for credit losses: 2025-$0; 2024-$0)Short-term investments$6.41 BRedeemable noncontrolling interestsRedeemable noncontrolling interests$2.79 BPolicyholder's dividendsPolicyholder's dividends$1.27 BAssets supporting experience-rated contractholder liabilities, at fair valueAssets supporting experience-ratedcontractholder liabilities, at fair value$4.84 BRetained EarningsRetained Earnings$34.83 BGross equity (calculated)Gross equity(calculated)$61.20 BAccrued investment incomeAccrued investment income$3.64 BAdditional paid-in capitalAdditional paid-in capital$26.01 BMarket risk benefit assetsMarket risk benefit assets$2.33 BCommon Stock ($0.01 par value; 1,500,000,000 shares authorized; 666,305,189 shares issued as of both December 31, 2025 and 2024)Common Stock$6.00 MValue of business acquiredValue of business acquired$397.00 MNoncontrolling InterestsNoncontrolling Interests$349.00 MIncome Tax AssetsIncome Tax Assets$279.00 MCommon Stock held in treasury, at cost (318,361,498 and 311,738,187 shares at December 31, 2025 and 2024, respectively)Common Stock held in treasury−$25.34 BAccumulated other comprehensive income (loss)Accumulated other comprehensive income (loss)−$3.08 B
Chart details

Prudential Financial, Inc. (PRU) FY2025 Annual Balance Sheet

Balance sheet as of 2025-12-31. The chart shows assets, liabilities and equity at that date.

Assets
773,740,000,000 US dollars
Liabilities
738,159,000,000 US dollars
Equity
32,787,000,000 US dollars
Redeemable noncontrolling interests
2,794,000,000 US dollars
Noncontrolling interest
349,000,000 US dollars. Included in consolidated equity; this amount is not added again.
Fixed maturities, available-for-sale, at fair value (allowance for credit losses: 2025-$183; 2024-$331) (amortized cost: 2025-$357,996; 2024-$341,004)
331,455,000,000 US dollars
Separate account assets
196,251,000,000 US dollars
Commercial mortgage and other loans (net of $469 and $574 allowance for credit losses; includes $1,056 and $702 of loans measured at fair value under the fair value option at December 31, 2025 and 2024, respectively)
64,715,000,000 US dollars
Reinsurance recoverables and deposit receivables (net of $14 and $12 allowance for credit losses; includes $573 and $849 of embedded derivatives at fair value at December 31, 2025 and 2024, respectively)
44,077,000,000 US dollars
Other invested assets (net of $2 and $2 allowance for credit losses; includes $8,285 and $7,574 of assets measured at fair value at December 31, 2025 and 2024, respectively)
27,294,000,000 US dollars
Deferred policy acquisition cost
21,530,000,000 US dollars
Cash and cash equivalents
19,712,000,000 US dollars
Other assets (net of $1 and $2 allowance for credit losses; includes $0 and $0 of assets at fair value at December 31, 2025 and 2024, respectively)
15,009,000,000 US dollars
Fixed maturities, trading, at fair value (amortized cost: 2025-$15,536; 2024-$13,631)
14,869,000,000 US dollars
Equity securities, at fair value (cost: 2025-$8,303; 2024-$7,043)
10,972,000,000 US dollars
Policy loans
9,958,000,000 US dollars
Short-term investments (net of allowance for credit losses: 2025-$0; 2024-$0)
6,414,000,000 US dollars
Assets supporting experience-rated contractholder liabilities, at fair value
4,842,000,000 US dollars
Accrued investment income
3,636,000,000 US dollars
Market risk benefit assets
2,330,000,000 US dollars
Value of business acquired
397,000,000 US dollars
Income Tax Assets
279,000,000 US dollars
Future policy benefits
266,914,000,000 US dollars
Separate account liabilities
196,251,000,000 US dollars
Policyholders' account balances
191,307,000,000 US dollars
Long-term debt
18,856,000,000 US dollars
Reinsurance and funds withheld payables (includes $174 and $(118) of embedded derivatives at fair value at December 31, 2025 and 2024, respectively)
18,844,000,000 US dollars
Other liabilities (includes $16 and $14 allowance for credit losses and $6,215 and $4,751 of derivatives at fair value at December 31, 2025 and 2024, respectively)
17,692,000,000 US dollars
Securities sold under agreements to repurchase
9,598,000,000 US dollars
Cash collateral for loaned securities
8,700,000,000 US dollars
Market risk benefit liabilities
4,623,000,000 US dollars
Notes issued by consolidated variable interest entities (includes $767 and $60 measured at fair value under the fair value option at December 31, 2025 and 2024, respectively)
2,659,000,000 US dollars
Short-term debt
1,443,000,000 US dollars
Policyholder's dividends
1,272,000,000 US dollars
Retained Earnings
34,831,000,000 US dollars
Additional paid-in capital
26,013,000,000 US dollars
Common Stock ($0.01 par value; 1,500,000,000 shares authorized; 666,305,189 shares issued as of both December 31, 2025 and 2024)
6,000,000 US dollars
Preferred Stock ($0.01 par value; 10,000,000 shares authorized; none issued)
0 US dollars
Noncontrolling Interests
349,000,000 US dollars
Common Stock held in treasury, at cost (318,361,498 and 311,738,187 shares at December 31, 2025 and 2024, respectively)
negative 25,335,000,000 US dollars
Accumulated other comprehensive income (loss)
negative 3,077,000,000 US dollars
Gross equity (calculated)
61,199,000,000 US dollars. Net equity plus the magnitudes of its negative contributions equals gross positive equity. The negative contributions enter this reconciliation as add-backs; their filed signs stay negative.

Chart connections

  • Assets equal liabilities plus temporary equity plus consolidated equity. Consolidated equity includes noncontrolling interests when reported.
  • Treasury shares and other negative equity contributions reduce equity.
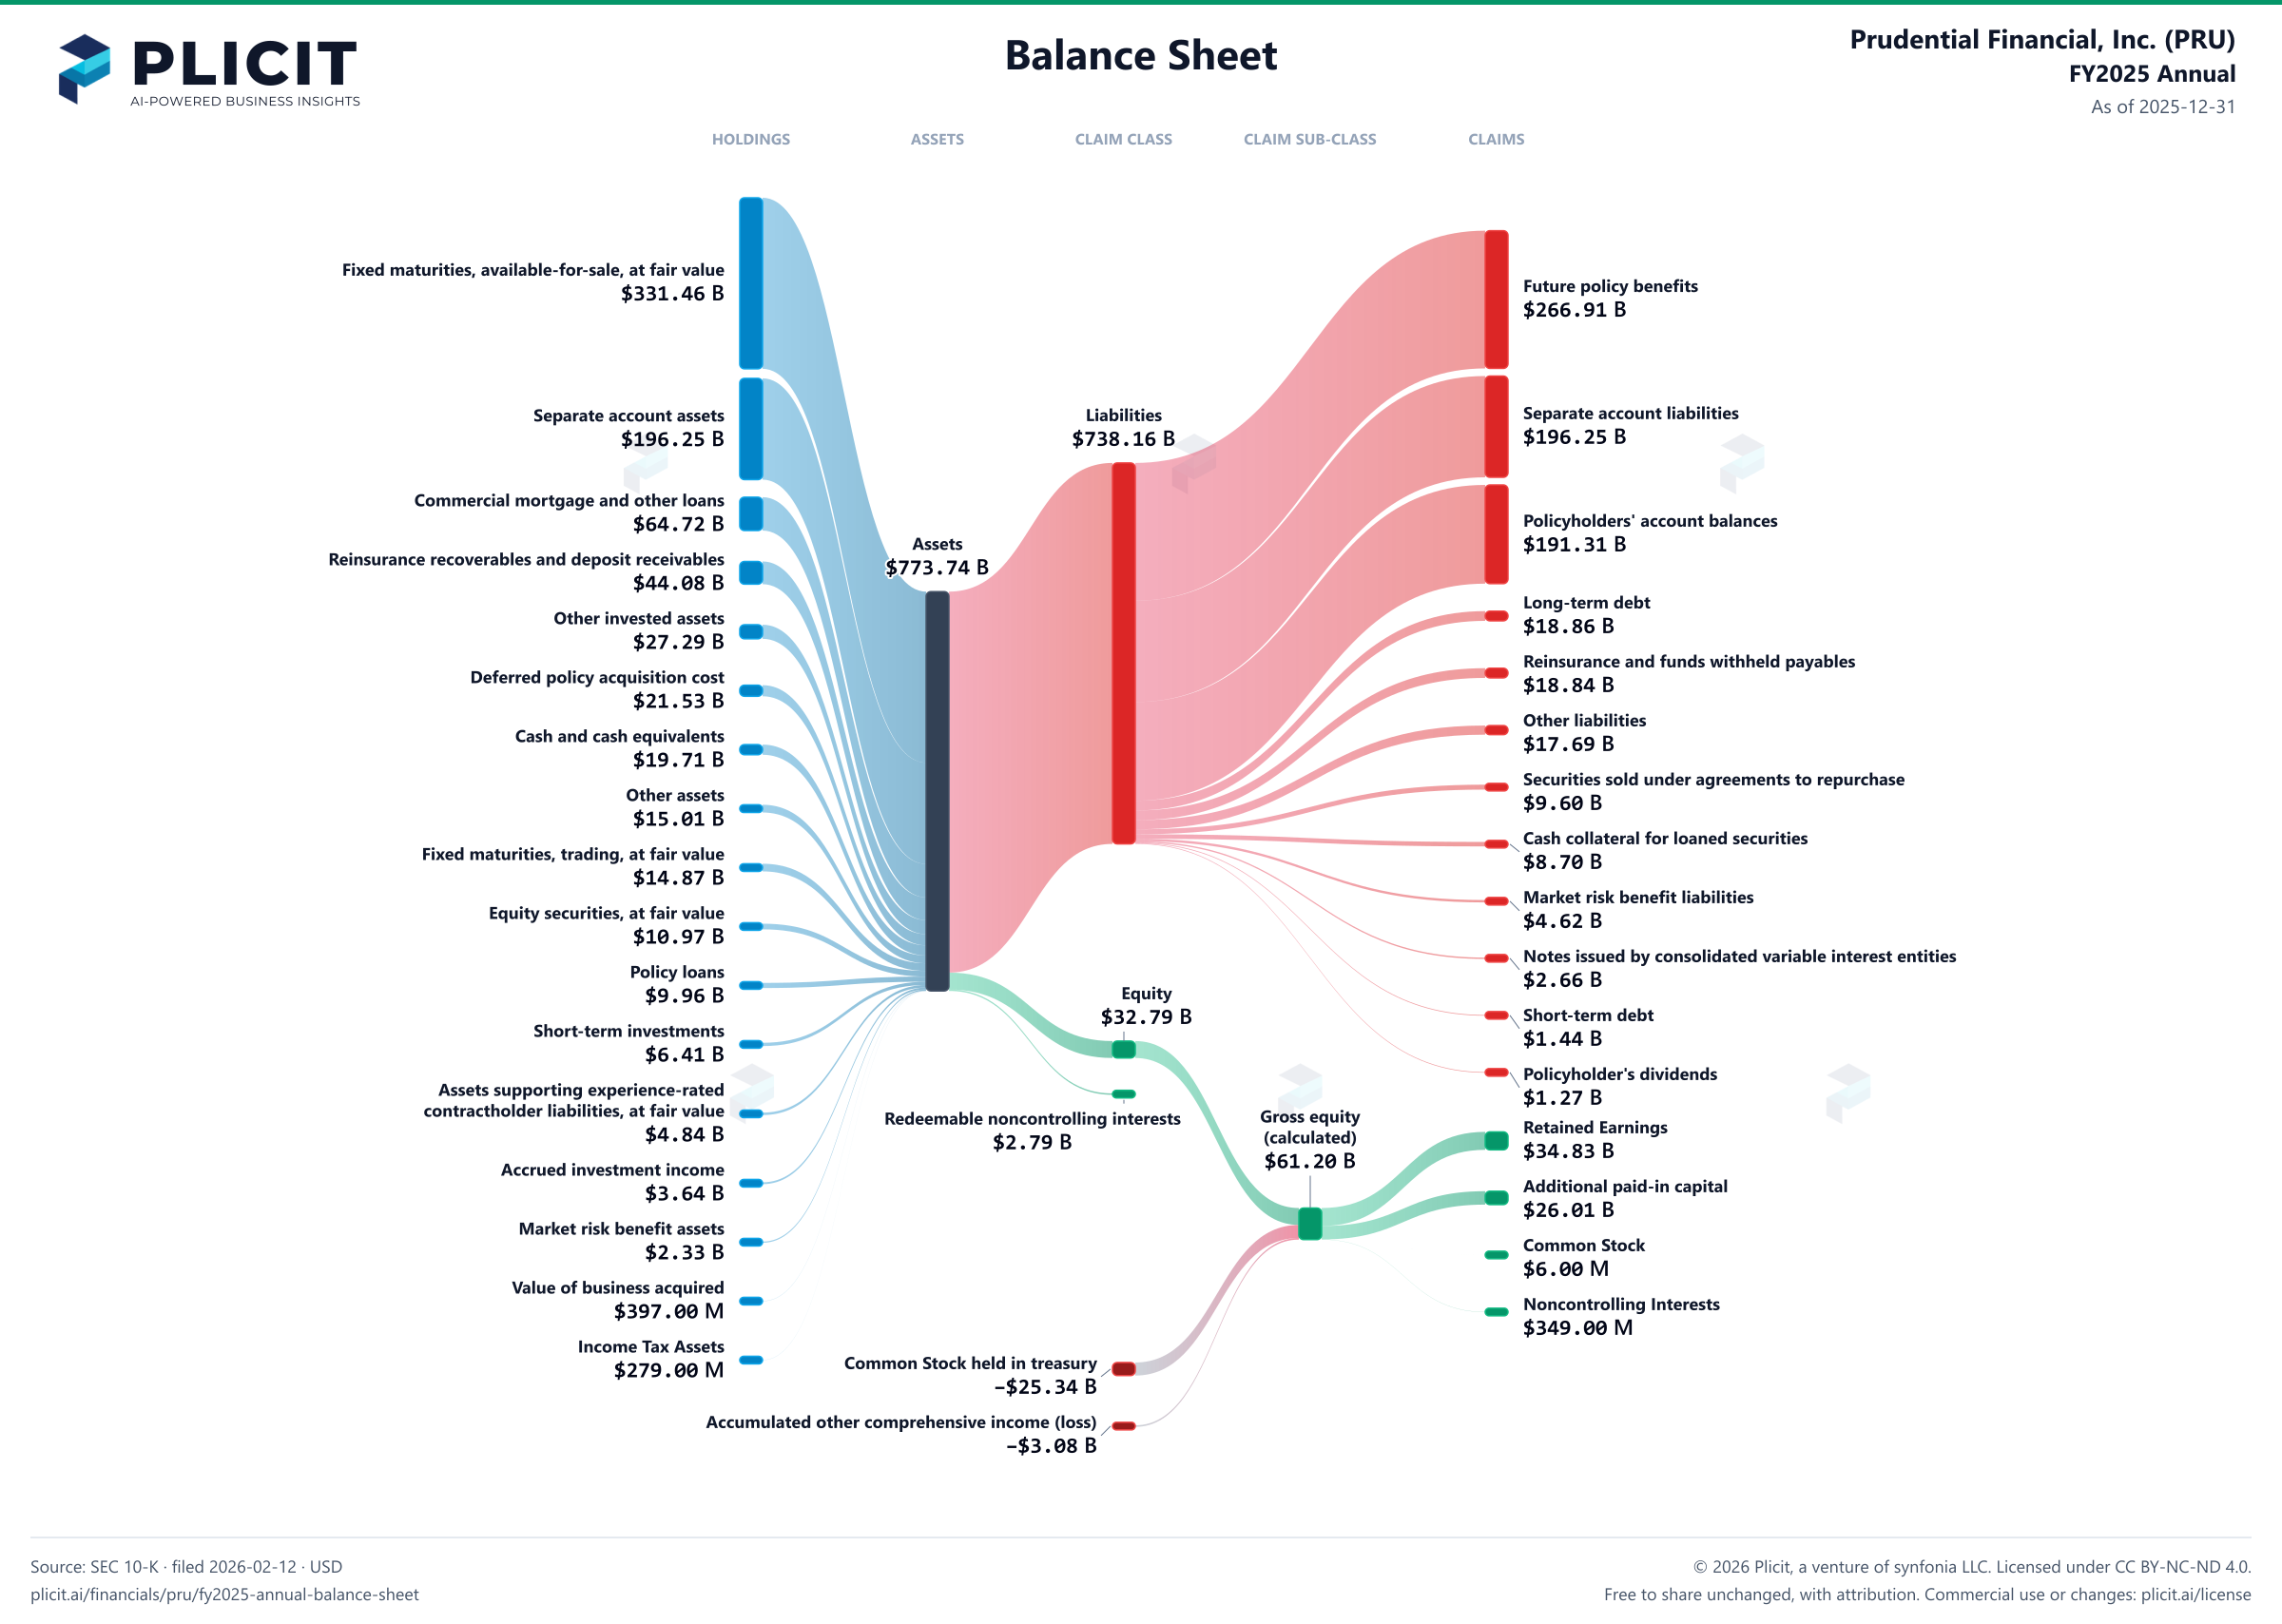
Prudential Financial, Inc. (PRU) FY2025 Annual Balance Sheet Sankey chart
Free to share unchanged, with credit to Plicit.ai · CC BY-NC-ND 4.0Download PNG

Newsletter

Get the teardowns by email

Subscribe if you want the public-company teardowns in your inbox when they're released.

Product waitlist

Health Check and Teardown for your own company

A health check uncovers insights of your private books, not a public ticker. Join this list to get notified as soon as we go-live!