
Hyperliquid Strategies Inc (PURR) FY2026 Annual Balance Sheet
As of 2026-06-30
Balance Sheet
As of 2026-06-30
Swipe to see the full flow
Chart details
Hyperliquid Strategies Inc (PURR) FY2026 Annual Balance Sheet
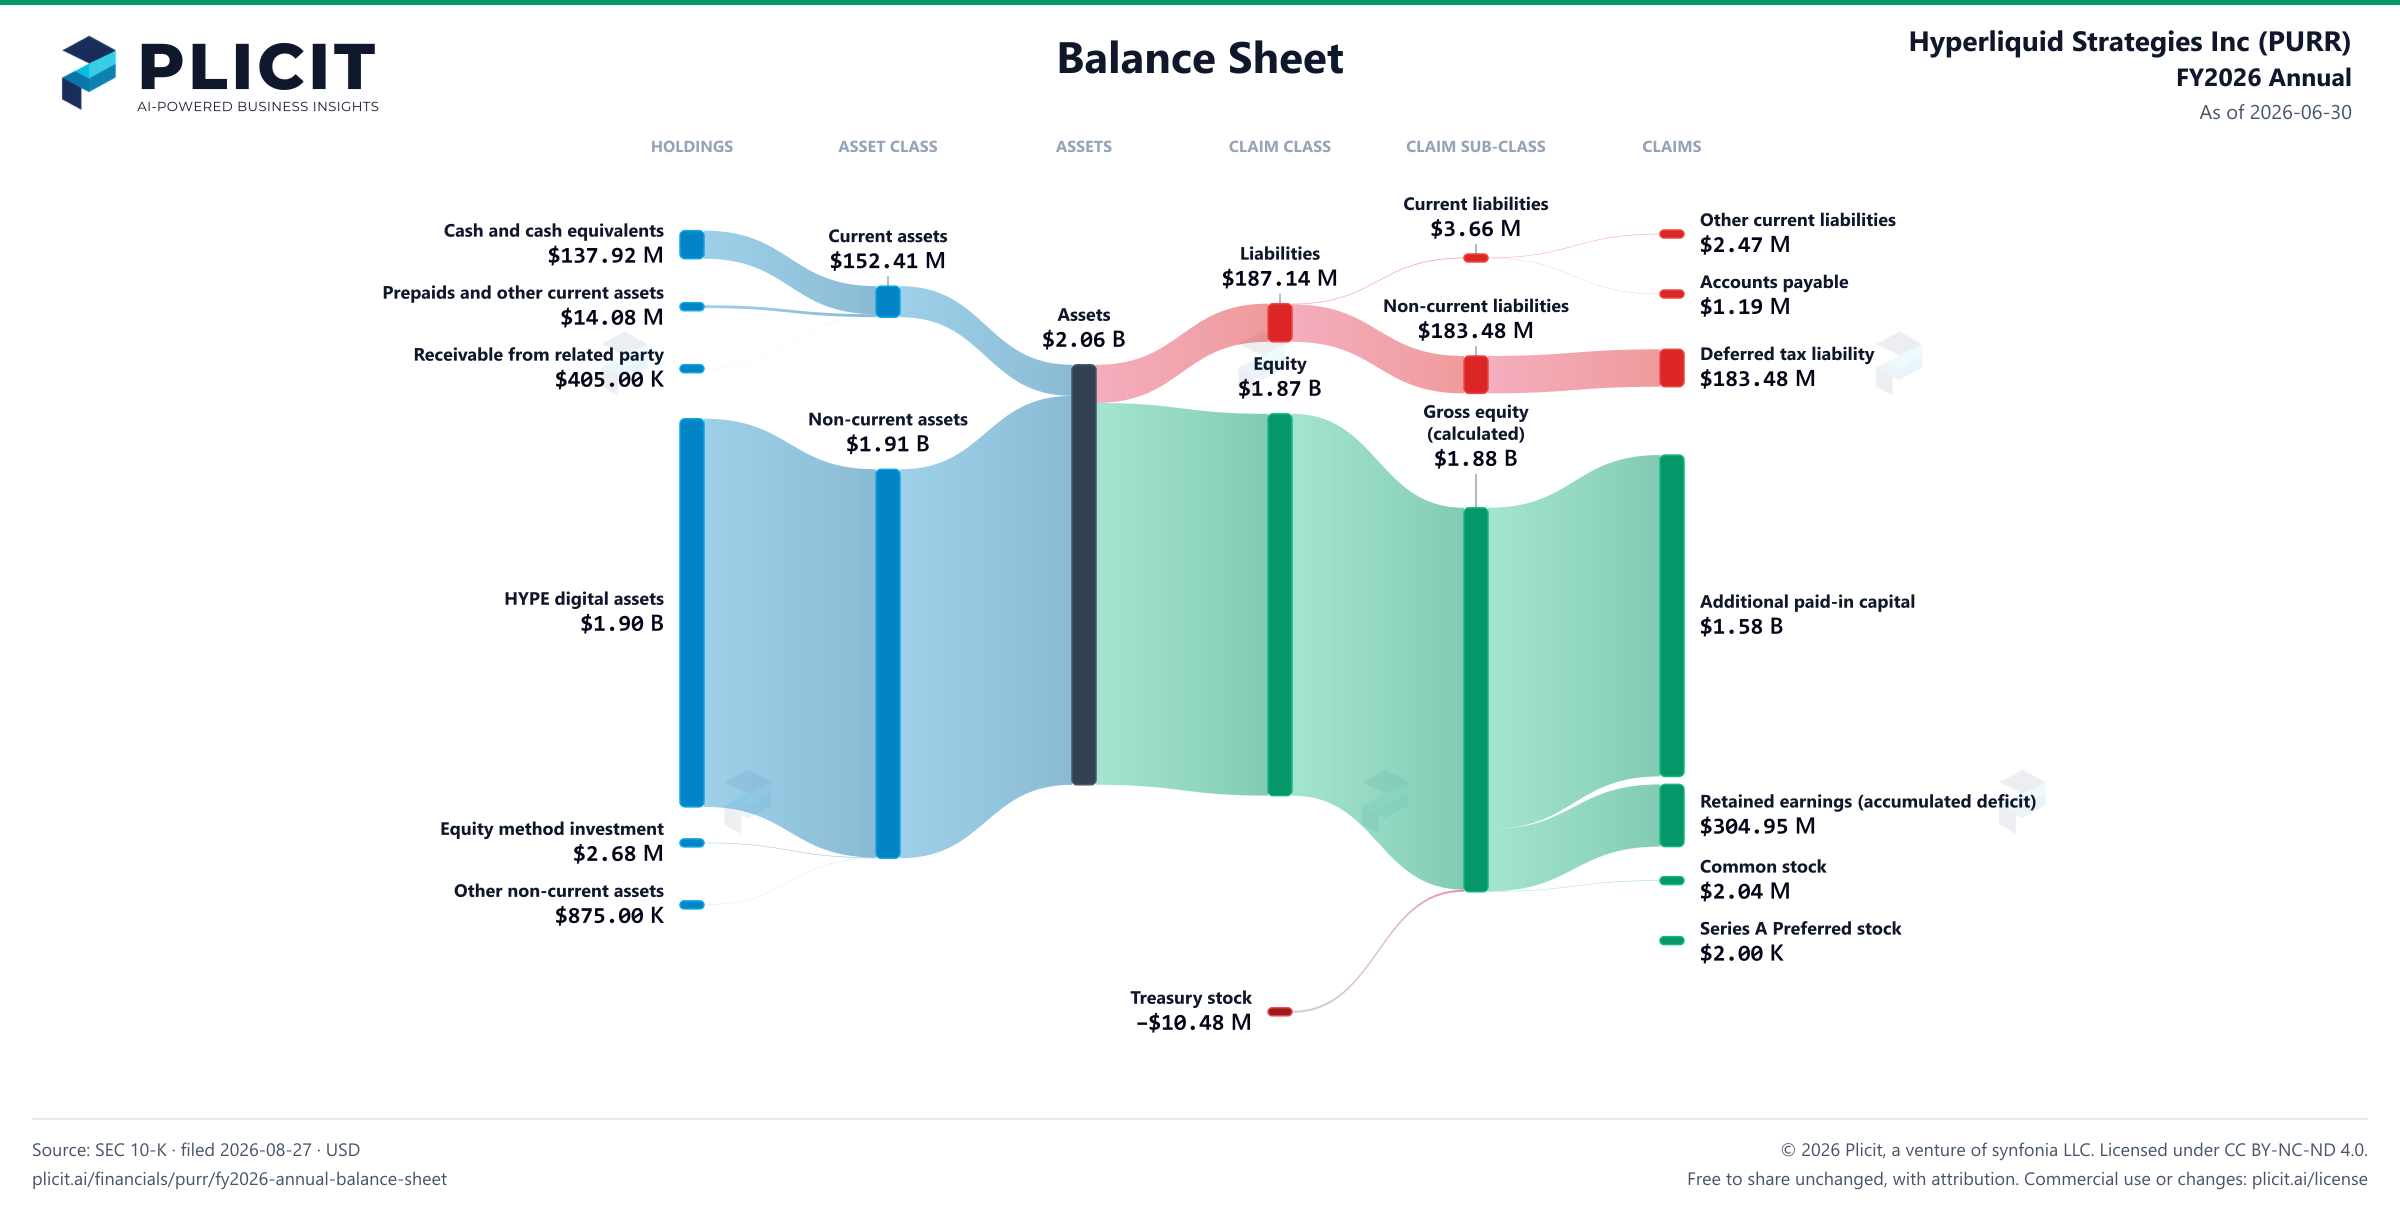
Balance sheet as of 2026-06-30. The chart shows assets, liabilities and equity at that date.
- Assets
- 2,060,008,000 US dollars
- Current assets
- 152,406,000 US dollars
- Non-current assets
- 1,907,602,000 US dollars
- Liabilities
- 187,137,000 US dollars
- Current liabilities
- 3,662,000 US dollars
- Non-current liabilities
- 183,475,000 US dollars
- Equity
- 1,872,871,000 US dollars
- Cash and cash equivalents
- 137,917,000 US dollars
- Prepaids and other current assets
- 14,084,000 US dollars
- Receivable from related party
- 405,000 US dollars
- HYPE digital assets
- 1,904,052,000 US dollars
- Equity method investment
- 2,675,000 US dollars
- Other non-current assets
- 875,000 US dollars
- Other current liabilities
- 2,472,000 US dollars
- Accounts payable
- 1,190,000 US dollars
- Deferred tax liability
- 183,475,000 US dollars
- Additional paid-in capital
- 1,576,369,000 US dollars
- Retained earnings (accumulated deficit)
- 304,945,000 US dollars
- Common stock, $0.01 par value, 2,000,000,000 and 0 shares authorized as of June 30, 2026 and June 30, 2025, respectively; 203,617,555 shares issued and 200,550,458 shares outstanding (excluding treasury shares of 3,067,097) as of June 30, 2026, and 0 shares issued and 0 shares outstanding (excluding treasury shares of 0) as of June 30, 2025
- 2,036,000 US dollars
- Series A Preferred stock, $0.01 par value, 100,000,000 and 0 shares authorized as of June 30, 2026 and June 30, 2025, respectively; 166,173 and 0 shares issued and outstanding as of June 30, 2026, and June 30, 2025, respectively
- 2,000 US dollars
- Treasury stock, at cost; 3,067,097 and 0 shares as of June 30, 2026, and June 30, 2025, respectively
- negative 10,481,000 US dollars
- Gross equity (calculated)
- 1,883,352,000 US dollars. Net equity plus the magnitudes of its negative contributions equals gross positive equity. The negative contributions enter this reconciliation as add-backs; their filed signs stay negative.
Chart connections
- Assets equal liabilities plus consolidated equity. Consolidated equity includes noncontrolling interests when reported.
- Treasury shares and other negative equity contributions reduce equity.
Free to share unchanged, with credit to Plicit.ai · CC BY-NC-ND 4.0Download PNG
Product waitlist
Health Check and Teardown for your own company
A health check uncovers insights of your private books, not a public ticker. Join this list to get notified as soon as we go-live!