
RESTAURANT BRANDS INTERNATIONAL INC. (QSR) FY2026 YTD Q3 P&L / Income Statement

Published · Updated Source: Form 10-Q on SEC EDGAR filed (opens in a new tab)

Revenue by Product and Service by Sales Channel

Swipe to see the full flow
RESTAURANT BRANDS INTERNATIONAL INC. (QSR) FY2026 YTD Q3 P&L / Income StatementIncome statement for 2026-01-01 through 2026-09-30. View: Product and Service by Contract with Customer, Sales Channel. Revenue uses this breakdown; costs and expenses retain the consolidated categories.SOURCESREVENUEGROSSOPERATINGPRE-TAXNETSupply chain sales and Company restaurant sales - Supply chain salesSupply chain sales and Company restaurant sales - Company restaurant salesRoyaltiesAdvertising revenues and other servicesUndisclosed (calculated)Franchise fees and other revenueTotal revenuesGross profit (calculated)Cost of revenue (calculated)Supply chain cost of sales and Company restaurant expensesIncome from operationsOperating expenses (calculated)General and administrative expensesFranchise and property expenses(Income) loss from equity method investmentsAdvertising expenses and other servicesOther operating expenses (income), netIncome from continuing operations before income taxesOther income (expense), net (calculated)Net incomeIncome tax (benefit) expense from continuing operationsIncome tax (benefit) expense from continuing operationsIncome tax (benefit)expense fromcontinuing operations−$168.00 MGross profit (calculated)Gross profit(calculated)$4.00 BTotal revenuesTotal revenues$7.31 BIncome from operationsIncome from operations$2.02 BNet incomeNet income$1.81 BSupply chain sales and Company restaurant sales - Supply chain salesSupply chain sales and Companyrestaurant sales - Supply chain sales$2.25 BIncome from continuing operations before income taxesIncome from continuingoperations beforeincome taxes$1.65 BOperating expenses (calculated)Operating expenses(calculated)$1.98 BSupply chain sales and Company restaurant sales - Company restaurant salesSupply chain sales andCompany restaurant sales -Company restaurant sales$1.78 BGeneral and administrative expensesGeneral andadministrative expenses$544.00 MOther income (expense), net (calculated)Other income,net (calculated)−$372.00 MCost of revenue (calculated)Cost of revenue(calculated)$3.31 BRoyaltiesRoyalties$1.57 BFranchise and property expensesFranchise and property expenses$409.00 M(Income) loss from equity method investments(Income) loss from equitymethod investments−$10.00 MAdvertising revenues and other servicesAdvertising revenuesand other services$942.00 MSupply chain cost of sales and Company restaurant expensesSupply chain cost ofsales and Companyrestaurant expenses$3.31 BUndisclosed (calculated)Undisclosed (calculated)$645.00 MAdvertising expenses and other servicesAdvertising expensesand other services$1.06 BFranchise fees and other revenueFranchise fees and other revenue$110.00 MOther operating expenses (income), netOther operatingexpenses (income), net−$27.00 M
Chart details

RESTAURANT BRANDS INTERNATIONAL INC. (QSR) FY2026 YTD Q3 P&L / Income Statement

Income statement for 2026-01-01 through 2026-09-30. View: Product and Service by Contract with Customer, Sales Channel. Revenue uses this breakdown; costs and expenses retain the consolidated categories.

Total revenues
7,309,000,000 US dollars
Cost of revenue (calculated)
3,311,000,000 US dollars
Gross profit (calculated)
3,998,000,000 US dollars
Operating expenses (calculated)
1,980,000,000 US dollars
Income from operations
2,018,000,000 US dollars
Other income (expense), net (calculated)
negative 372,000,000 US dollars
Income from continuing operations before income taxes
1,646,000,000 US dollars
Income tax (benefit) expense from continuing operations
negative 168,000,000 US dollars
Net income
1,814,000,000 US dollars
Advertising revenues and other services
942,000,000 US dollars
Franchise fees and other revenue
110,000,000 US dollars
Royalties
1,574,000,000 US dollars
Supply chain sales and Company restaurant sales - Company restaurant sales
1,784,000,000 US dollars
Supply chain sales and Company restaurant sales - Supply chain sales
2,254,000,000 US dollars
Undisclosed (calculated)
645,000,000 US dollars
Supply chain cost of sales and Company restaurant expenses
3,311,000,000 US dollars
Franchise and property expenses
409,000,000 US dollars
Advertising expenses and other services
1,064,000,000 US dollars
General and administrative expenses
544,000,000 US dollars
(Income) loss from equity method investments
negative 10,000,000 US dollars
Other operating expenses (income), net
negative 27,000,000 US dollars
Net loss from discontinued operations (net of tax of $0)
0 US dollars. Reported below-tax contribution to net income.

Chart connections

  • Revenue less cost of revenue equals gross profit; gross profit less operating expenses equals operating income.
  • Operating income plus other income or expense equals income before tax. Income before tax less income tax expense or benefit, plus the explicitly reported below-tax contributions, equals net income.
  • Of which attributable to RESTAURANT BRANDS INTERNATIONAL INC.: $1.39 B; to noncontrolling interests: $427.00 M.
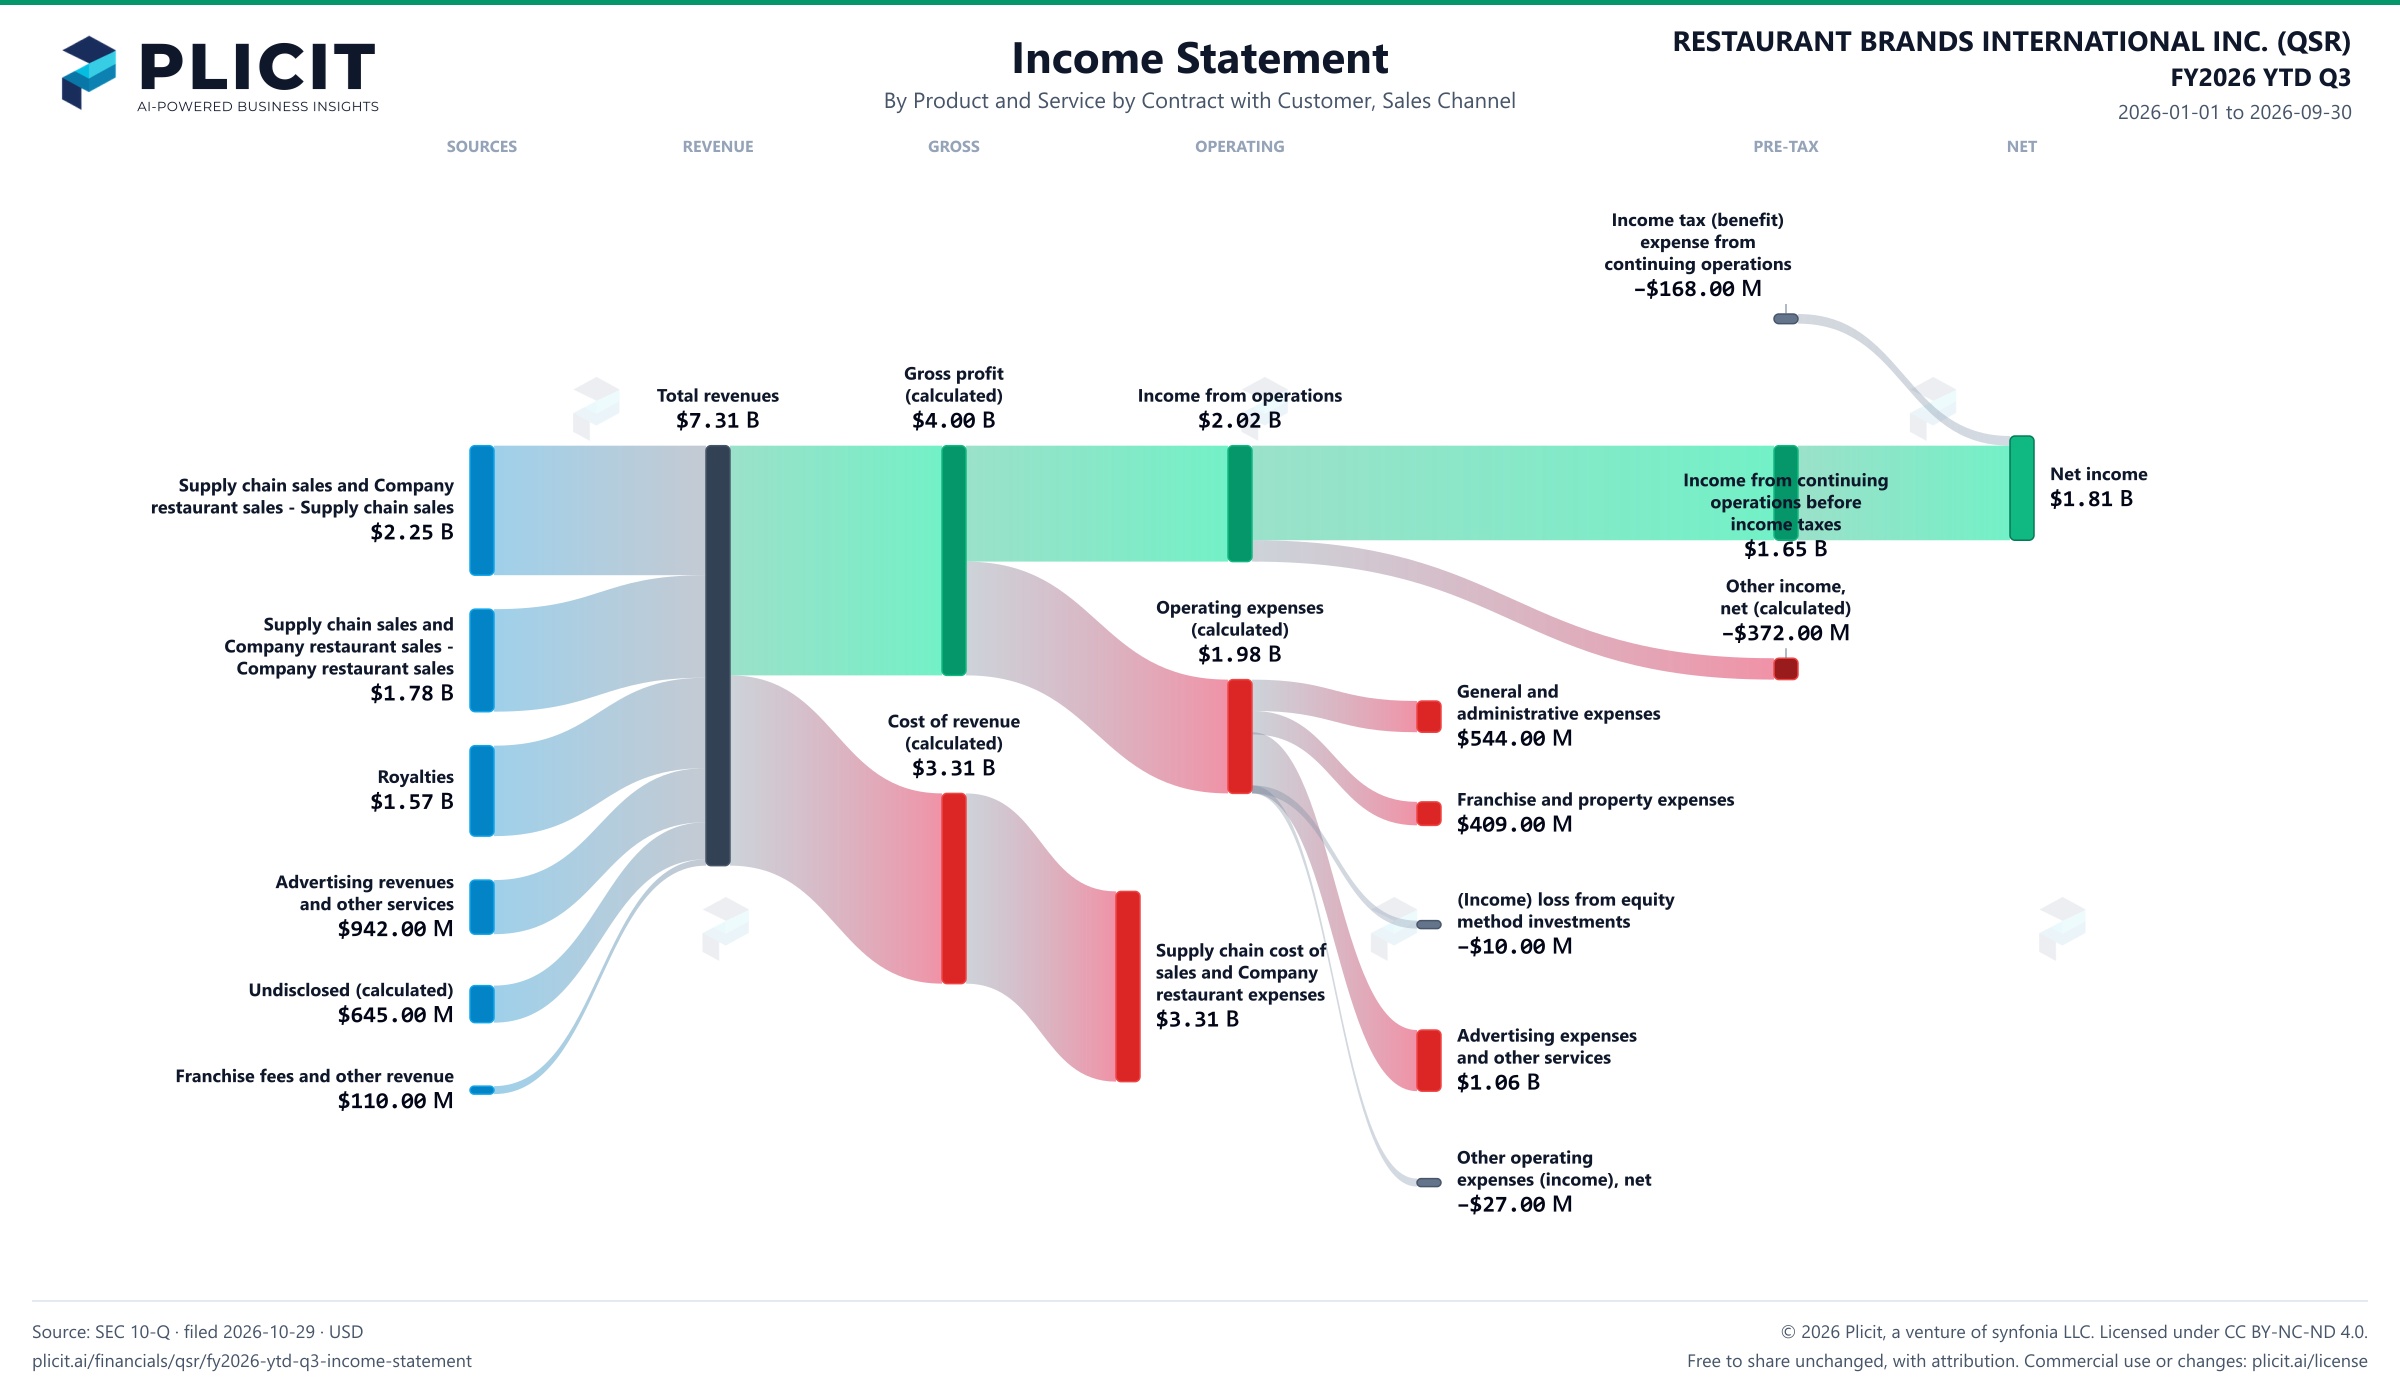
RESTAURANT BRANDS INTERNATIONAL INC. (QSR) FY2026 YTD Q3 P&L / Income Statement Sankey chart, Product and service — Product and Service by Contract with Customer, Sales Channel view
Free to share unchanged, with credit to Plicit.ai · CC BY-NC-ND 4.0Download PNG

Product waitlist

Health Check and Teardown for your own company

A health check uncovers insights of your private books, not a public ticker. Join this list to get notified as soon as we go-live!