
RESTAURANT BRANDS INTERNATIONAL INC. (QSR) FY2026 Q3 P&L / Income Statement

Published · Updated Source: Form 10-Q on SEC EDGAR filed (opens in a new tab)

Key Takeaways

  • Net income of $704.00 M was 28% of sales, the yardstick for comparing profit across companies.
  • Pretax income was $571.00 M, so a $133.00 M tax benefit lifted profit above it.
  • Outside owners were due 23% of profit, $162.00 M, down from 28% a year earlier.
  • Cost of goods and services sold is the biggest expense, at $44.63 of every $100 of sales.

The Unvarnished Truth

Profit of $704.00 M beat pretax income thanks to a tax benefit

Profit of $704.00 M looks healthy, with a 28% net margin on $2.53 B of sales. The operating business earned $696.00 M, but pretax income was only $571.00 M after $125.00 M of net interest. The gap between pretax income and profit is a tax benefit of $133.00 M, where a year earlier the line was an expense. The sections on results do not explain what produced that benefit. Strip the benefit out and the net margin falls to about 23%. A reader should read the 28% with that in mind.

Outside owners of the subsidiaries took $162.00 M, which is 23% of profit. A year earlier that share was 28%, so outside owners' slice of profit fell. Interest is the next drag, and operating profit covered net interest 5.6 times. Reported profit is therefore helped by the tax line, while the operating line carries the debt cost. The mix of those items tells you more about quality than the headline does. Each of these lines is worth a question before a reader trusts the headline.

Watch the next quarter's tax line, because a benefit this size can reverse. The filing says cash taxes will keep rising, which sits oddly beside a book benefit. Watch whether operating profit keeps covering net interest at 5.6 times or better, and whether outside owners keep their 23% share. A reader who sees only the headline profit misses both of these lines, and that is the point of reading past the front page. Would the company still report $704.00 M of profit if the tax line returned to an expense?
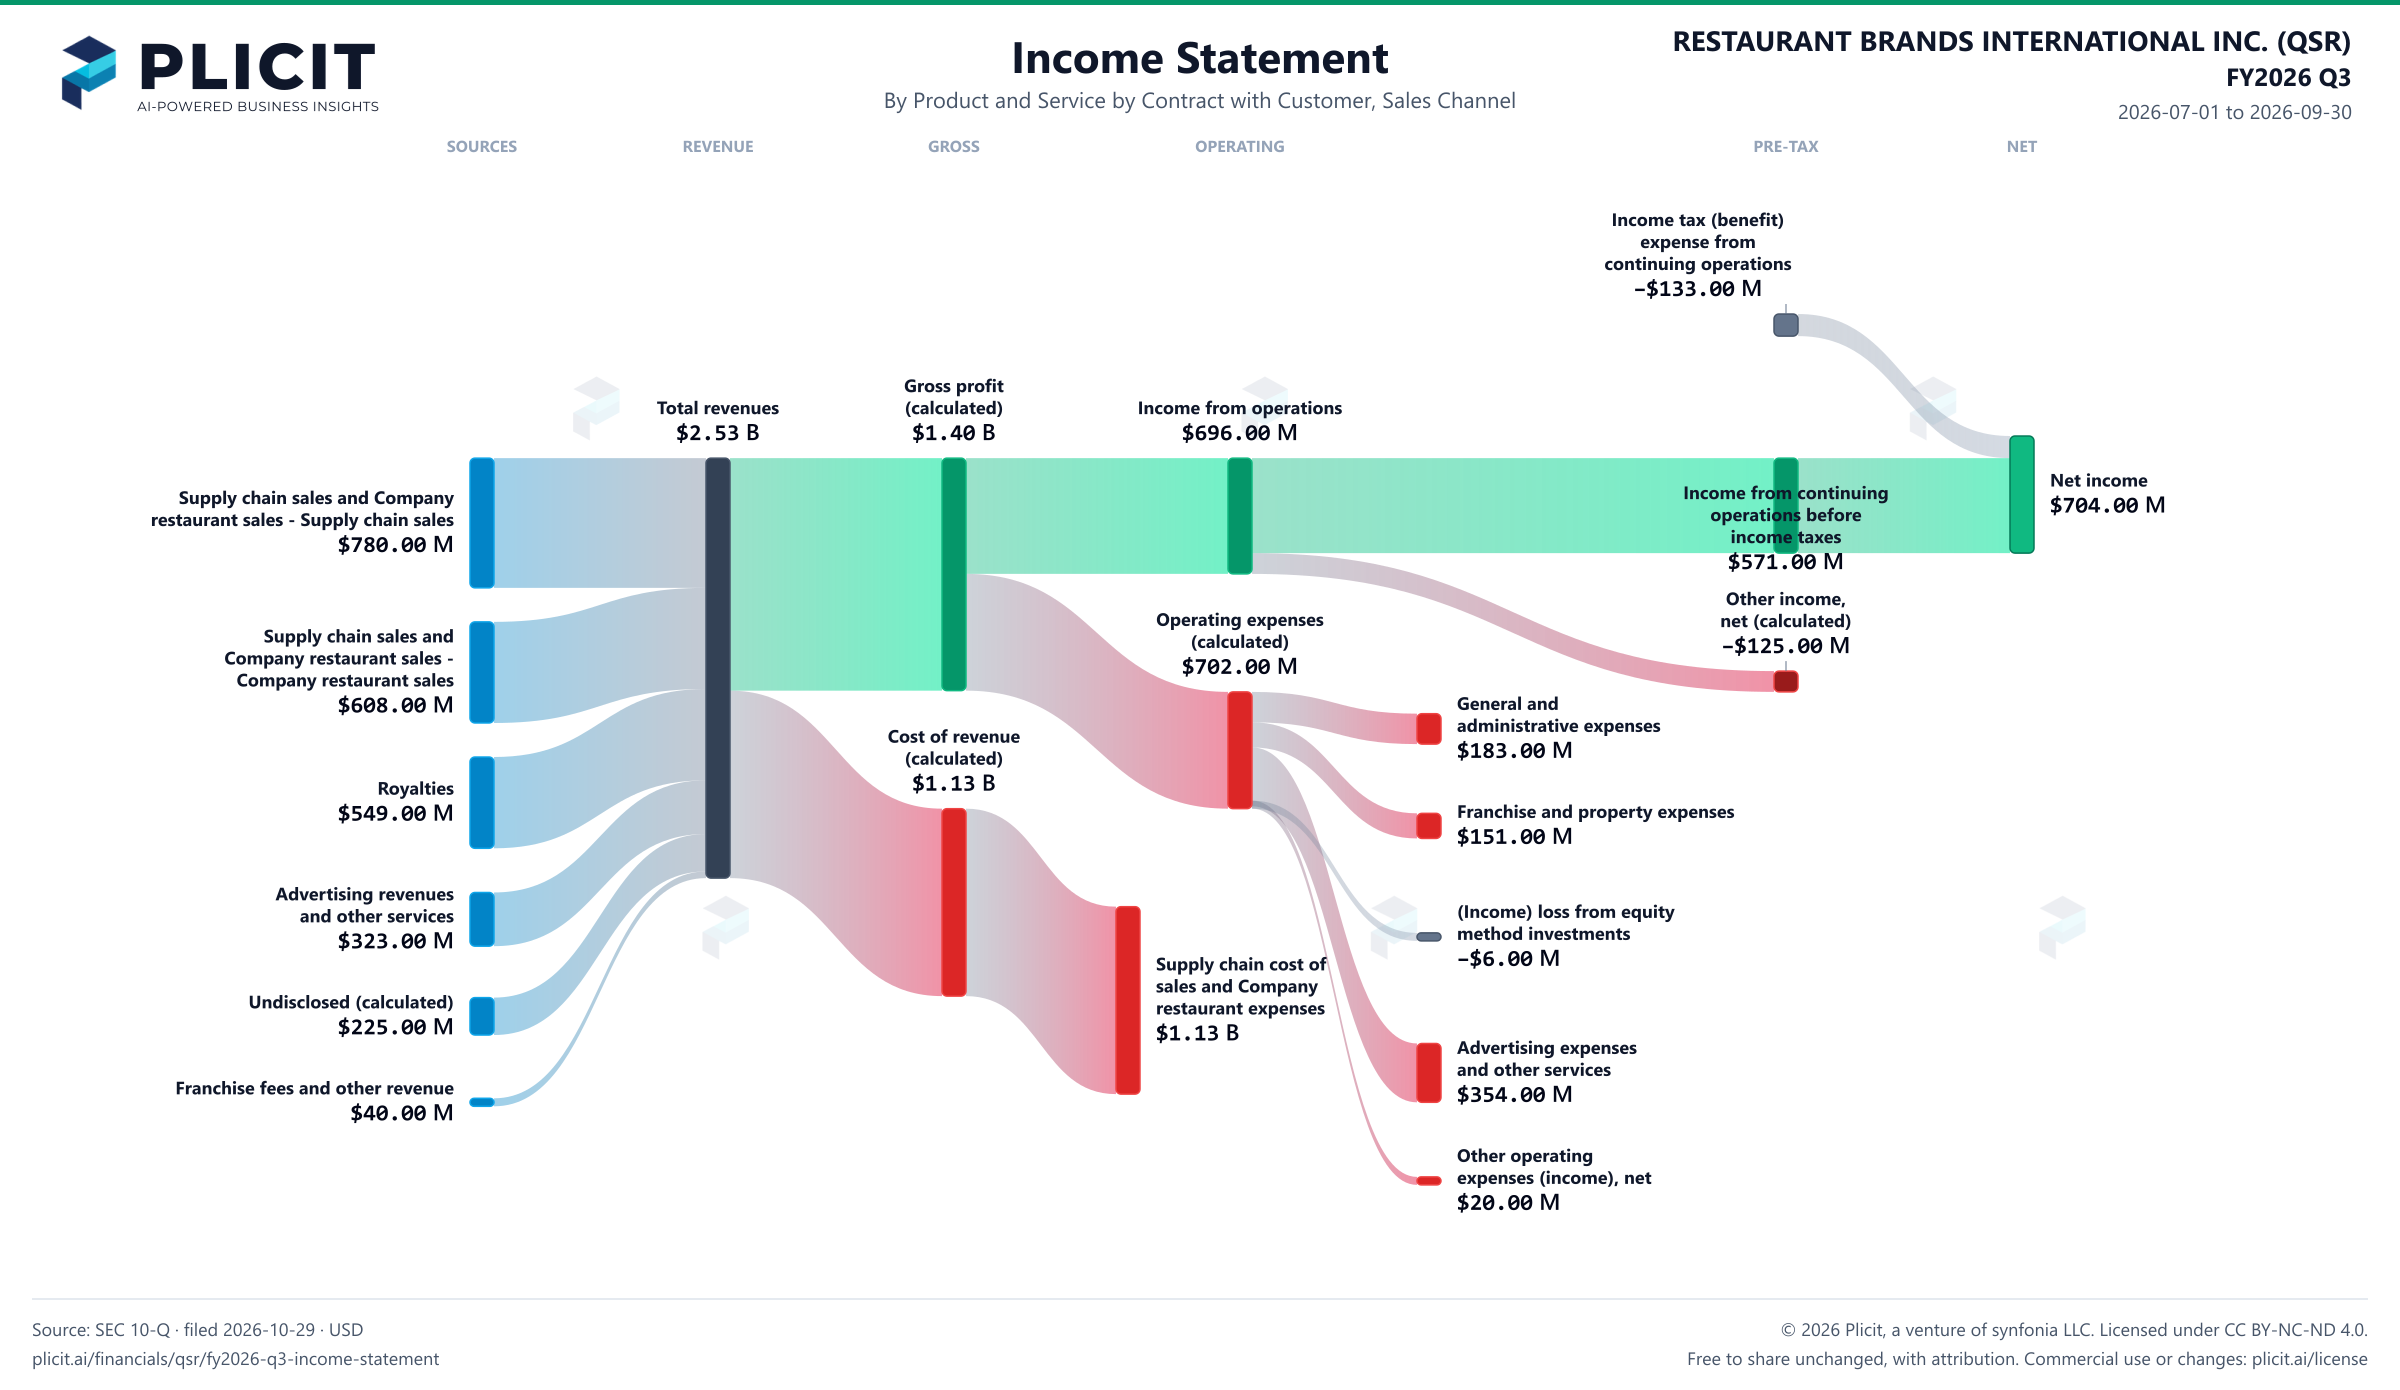
Revenue by Product and Service by Sales Channel

Swipe to see the full flow
RESTAURANT BRANDS INTERNATIONAL INC. (QSR) FY2026 Q3 P&L / Income StatementIncome statement for 2026-07-01 through 2026-09-30. View: Product and Service by Contract with Customer, Sales Channel. Revenue uses this breakdown; costs and expenses retain the consolidated categories.SOURCESREVENUEGROSSOPERATINGPRE-TAXNETSupply chain sales and Company restaurant sales - Supply chain salesSupply chain sales and Company restaurant sales - Company restaurant salesRoyaltiesAdvertising revenues and other servicesUndisclosed (calculated)Franchise fees and other revenueTotal revenuesGross profit (calculated)Cost of revenue (calculated)Supply chain cost of sales and Company restaurant expensesIncome from operationsOperating expenses (calculated)General and administrative expensesFranchise and property expenses(Income) loss from equity method investmentsAdvertising expenses and other servicesOther operating expenses (income), netIncome from continuing operations before income taxesOther income (expense), net (calculated)Net incomeIncome tax (benefit) expense from continuing operationsIncome tax (benefit) expense from continuing operationsIncome tax (benefit)expense fromcontinuing operations−$133.00 MGross profit (calculated)Gross profit(calculated)$1.40 BTotal revenuesTotal revenues$2.53 BIncome from operationsIncome from operations$696.00 MNet incomeNet income$704.00 MSupply chain sales and Company restaurant sales - Supply chain salesSupply chain sales and Companyrestaurant sales - Supply chain sales$780.00 MIncome from continuing operations before income taxesIncome from continuingoperations beforeincome taxes$571.00 MOperating expenses (calculated)Operating expenses(calculated)$702.00 MSupply chain sales and Company restaurant sales - Company restaurant salesSupply chain sales andCompany restaurant sales -Company restaurant sales$608.00 MGeneral and administrative expensesGeneral andadministrative expenses$183.00 MOther income (expense), net (calculated)Other income,net (calculated)−$125.00 MCost of revenue (calculated)Cost of revenue(calculated)$1.13 BRoyaltiesRoyalties$549.00 MFranchise and property expensesFranchise and property expenses$151.00 M(Income) loss from equity method investments(Income) loss from equitymethod investments−$6.00 MAdvertising revenues and other servicesAdvertising revenuesand other services$323.00 MSupply chain cost of sales and Company restaurant expensesSupply chain cost ofsales and Companyrestaurant expenses$1.13 BUndisclosed (calculated)Undisclosed (calculated)$225.00 MAdvertising expenses and other servicesAdvertising expensesand other services$354.00 MFranchise fees and other revenueFranchise fees and other revenue$40.00 MOther operating expenses (income), netOther operatingexpenses (income), net$20.00 M
Chart details

RESTAURANT BRANDS INTERNATIONAL INC. (QSR) FY2026 Q3 P&L / Income Statement

Income statement for 2026-07-01 through 2026-09-30. View: Product and Service by Contract with Customer, Sales Channel. Revenue uses this breakdown; costs and expenses retain the consolidated categories.

Total revenues
2,525,000,000 US dollars
Cost of revenue (calculated)
1,127,000,000 US dollars
Gross profit (calculated)
1,398,000,000 US dollars
Operating expenses (calculated)
702,000,000 US dollars
Income from operations
696,000,000 US dollars
Other income (expense), net (calculated)
negative 125,000,000 US dollars
Income from continuing operations before income taxes
571,000,000 US dollars
Income tax (benefit) expense from continuing operations
negative 133,000,000 US dollars
Net income
704,000,000 US dollars
Advertising revenues and other services
323,000,000 US dollars
Franchise fees and other revenue
40,000,000 US dollars
Royalties
549,000,000 US dollars
Supply chain sales and Company restaurant sales - Company restaurant sales
608,000,000 US dollars
Supply chain sales and Company restaurant sales - Supply chain sales
780,000,000 US dollars
Undisclosed (calculated)
225,000,000 US dollars
Supply chain cost of sales and Company restaurant expenses
1,127,000,000 US dollars
Franchise and property expenses
151,000,000 US dollars
Advertising expenses and other services
354,000,000 US dollars
General and administrative expenses
183,000,000 US dollars
(Income) loss from equity method investments
negative 6,000,000 US dollars
Other operating expenses (income), net
20,000,000 US dollars
Net loss from discontinued operations (net of tax of $0)
0 US dollars. Reported below-tax contribution to net income.

Chart connections

  • Revenue less cost of revenue equals gross profit; gross profit less operating expenses equals operating income.
  • Operating income plus other income or expense equals income before tax. Income before tax less income tax expense or benefit, plus the explicitly reported below-tax contributions, equals net income.
  • Of which attributable to RESTAURANT BRANDS INTERNATIONAL INC.: $542.00 M; to noncontrolling interests: $162.00 M.
RESTAURANT BRANDS INTERNATIONAL INC. (QSR) FY2026 Q3 P&L / Income Statement Sankey chart, Product and service — Product and Service by Contract with Customer, Sales Channel view
Free to share unchanged, with credit to Plicit.ai · CC BY-NC-ND 4.0Download PNG

Intelligent Insights for Investors

Did Restaurant Brands International make a profit this period?

Yes, $704.00 M this quarter. Its net margin, the share of sales left as profit once every cost is counted, was 28%.

How much of Restaurant Brands International's profit comes from its main business?

All of it, and then some. The core business made $696.00 M this quarter. Items outside it, the largest being interest, cost $125.00 M, which is why pretax profit came in lower.

Intelligent Insights for Customers

How much does Restaurant Brands International keep after the direct cost of what it sells?

After its cost of goods and services sold, it kept 55.4% of its sales this quarter, against 54.4% a year earlier. That gross margin, the share of sales kept after direct costs, is the cushion for everything else.

Product waitlist

Health Check and Teardown for your own company

A health check uncovers insights of your private books, not a public ticker. Join this list to get notified as soon as we go-live!