
RAVE RESTAURANT GROUP, INC. (RAVE) FY2026 Annual P&L / Income Statement

Income StatementBalance Sheet

Revenue by Product and Service

2025-06-30 to 2026-06-28

Swipe to see the full flow
RAVE RESTAURANT GROUP, INC. (RAVE) FY2026 Annual P&L / Income StatementIncome statement for 2025-06-30 through 2026-06-28. View: Product and service. Revenue uses this breakdown; costs and expenses retain the consolidated categories.SOURCESREVENUEOPERATINGPRE-TAXNETSupplier and Distributor Incentive RevenuesFranchise RoyaltiesAdvertising Fund ContributionsSupplier Convention FundsFranchise License FeesArea Development Exclusivity Fees and Foreign Master License FeesOther Franchise RevenueREVENUESOPERATING INCOMETotal costs and expensesGeneral and administrative expensesFranchise expensesDepreciation and amortization expenseProvision (recovery) for credit lossesOther income (expense), net (calculated)INCOME BEFORE TAXESNET INCOMEIncome tax expenseOther income (expense), net (calculated)Other income,net (calculated)$410.00 KINCOME BEFORE TAXESINCOME BEFORE TAXES$3.88 MREVENUESREVENUES$12.91 MOPERATING INCOMEOPERATING INCOME$3.47 MNET INCOMENET INCOME$2.88 MSupplier and Distributor Incentive RevenuesSupplier andDistributorIncentive Revenues$5.73 MTotal costs and expensesCosts and expenses$9.44 MIncome tax expenseIncome tax expense$1.01 MFranchise RoyaltiesFranchise Royalties$4.68 MGeneral and administrative expensesGeneral andadministrative expenses$5.90 MAdvertising Fund ContributionsAdvertising FundContributions$2.16 MFranchise expensesFranchise expenses$3.36 MSupplier Convention FundsSupplierConvention Funds$209.00 KDepreciation and amortization expenseDepreciation andamortization expense$167.00 KFranchise License FeesFranchiseLicense Fees$106.00 KProvision (recovery) for credit lossesProvision (recovery)for credit losses$7.00 KArea Development Exclusivity Fees and Foreign Master License FeesArea DevelopmentExclusivity Feesand Foreign Master…$12.00 KOther Franchise RevenueOther FranchiseRevenue$15.00 K
Chart details

RAVE RESTAURANT GROUP, INC. (RAVE) FY2026 Annual P&L / Income Statement

Income statement for 2025-06-30 through 2026-06-28. View: Product and service. Revenue uses this breakdown; costs and expenses retain the consolidated categories.

REVENUES
12,910,000 US dollars
Total costs and expenses
9,436,000 US dollars
OPERATING INCOME
3,474,000 US dollars
Other income (expense), net (calculated)
410,000 US dollars
INCOME BEFORE TAXES
3,884,000 US dollars
Income tax expense
1,006,000 US dollars
NET INCOME
2,878,000 US dollars
Franchise Royalties
4,679,000 US dollars
Supplier and Distributor Incentive Revenues
5,728,000 US dollars
Franchise License Fees
106,000 US dollars
Area Development Exclusivity Fees and Foreign Master License Fees
12,000 US dollars
Advertising Fund Contributions
2,161,000 US dollars
Supplier Convention Funds
209,000 US dollars
Rental Income
0 US dollars
Other Franchise Revenue
15,000 US dollars
General and administrative expenses
5,898,000 US dollars
Franchise expenses
3,364,000 US dollars
Provision (recovery) for credit losses
7,000 US dollars
Depreciation and amortization expense
167,000 US dollars

Chart connections

  • Revenue minus operating expenses equals operating income.
  • Operating income plus other income or expense equals income before tax. Income before tax less income tax expense or benefit equals net income.
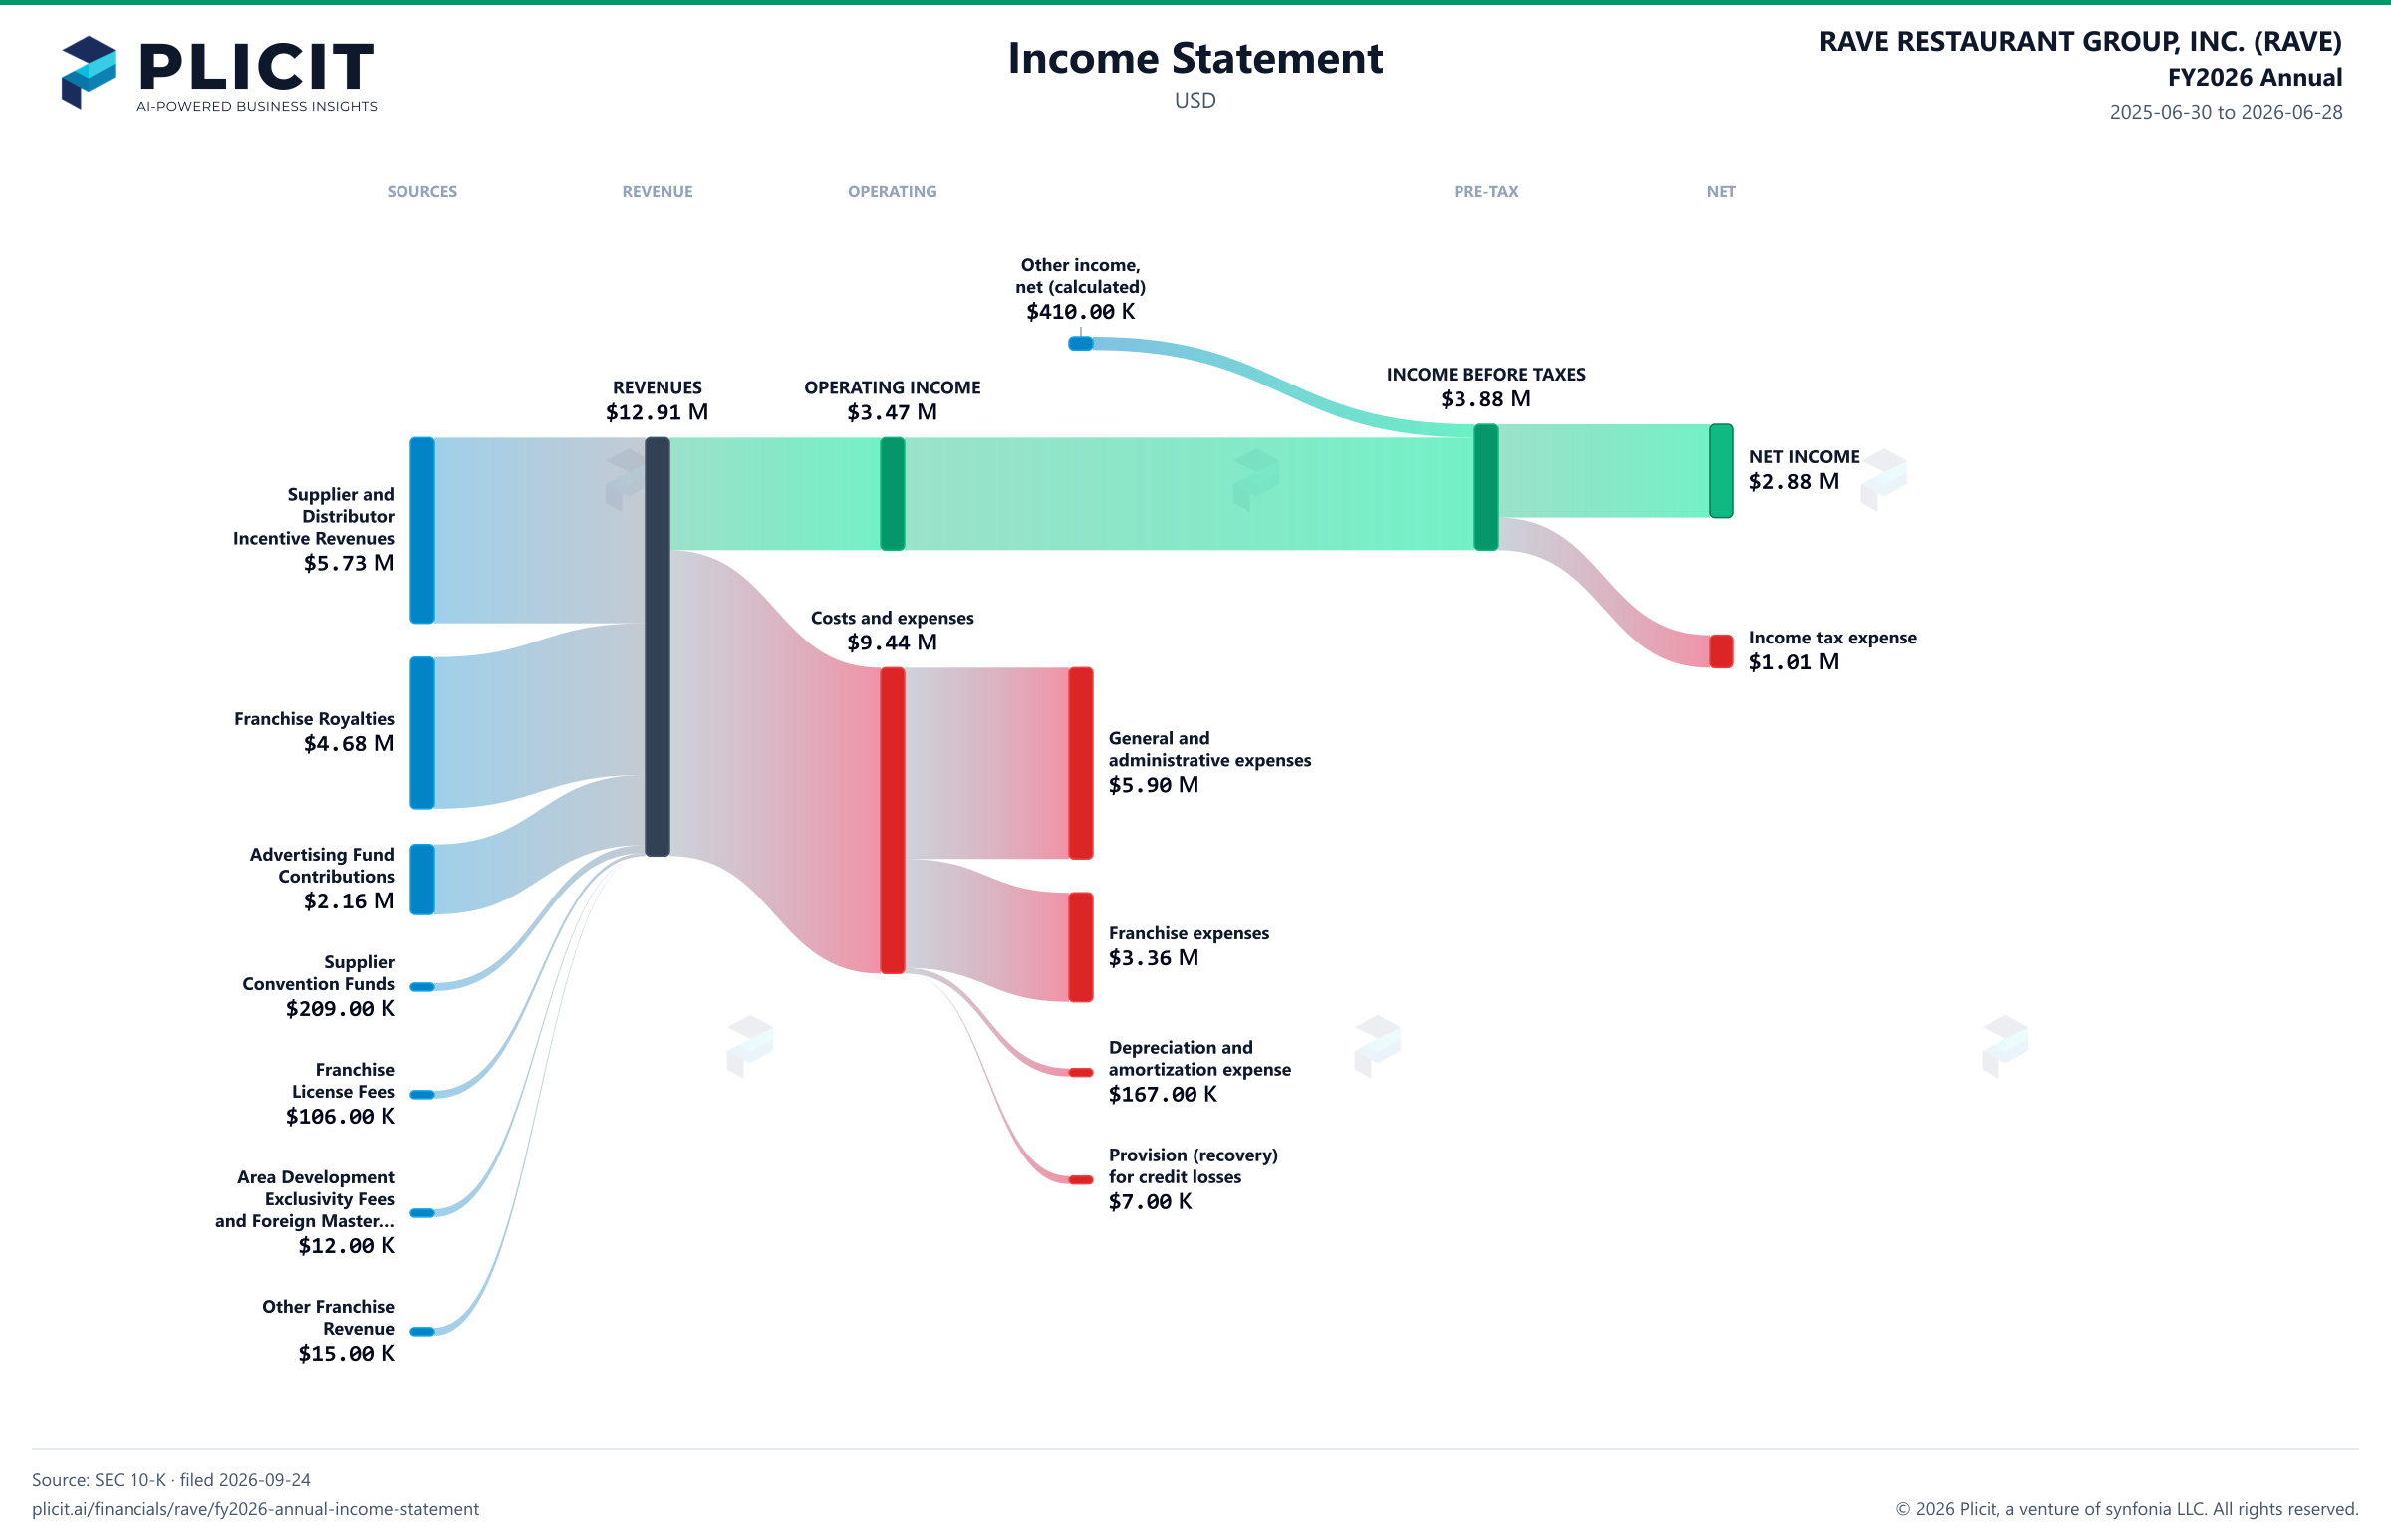
RAVE RESTAURANT GROUP, INC. (RAVE) FY2026 Annual P&L / Income Statement Sankey chart, Product and service view
Free to share unchanged, with credit to Plicit.ai · CC BY-NC-ND 4.0Download PNG

Operating margin

26.9%

Operating profit / revenue

Cash conversion

123.4%

Operating cash / net income, same period

Newsletter

Get the teardowns by email

Subscribe if you want the public-company teardowns in your inbox when they're released.

Product waitlist

Health Check and Teardown for your own company

A health check uncovers insights of your private books, not a public ticker. Join this list to get notified as soon as we go-live!