
Super Micro Computer, Inc. (SMCI) FY2026 Annual P&L / Income Statement

Published · Updated Source: Form 10-K on SEC EDGAR filed (opens in a new tab)

Key Takeaways

  • The United States supplied $27.69 B of sales, 71% of the total, up from 59% a year earlier.
  • The United States added $14.64 B of the $17.09 B revenue increase, most of the growth.
  • Europe was the one large region that shrank, down 1.9% from a year earlier.
  • One customer alone accounted for 28.1% of sales, and the filing calls that a concentration risk.

The Unvarnished Truth

The United States carried most of Super Micro Computer's revenue growth

Super Micro Computer's sales by region show one country carrying the growth. The United States supplied $27.69 B in fiscal 2026, up $14.64 B from a year earlier, which is most of the $17.09 B rise in revenue. That lifted the United States to 71% of sales, against 59% the year before. Asia grew 10%, Europe slipped 1.9%, and Other more than tripled. The four regions add up exactly to the $39.06 B total, and each comes from the same table in the filing's revenue note.

The filing says its regional split follows where products were shipped to. Its risk language explains why that matters. One customer accounted for 28.1% of sales, and the filing warns that if key customers reduce their orders, the business could face substantial financial instability. The fiscal 2025 table named Thailand at 10.9% of revenue; the 2026 disclosure names no other country, saying each one is below 10%. Asia, second in the table, brought in $6.06 B. The regional lens therefore shows the company's dependence as much as its reach.

The growth so far rests on one country and one buyer. The United States is 71% of sales this year, and one customer is 28.1%. If that customer's orders slowed, the company's totals would feel it, and the filing does not say which region that customer sits in. The concentration note gives the percentage, not the customer's name, so for now the question stays open. Would revenue hold up if that one customer ordered less, or does the growth depend on it alone?
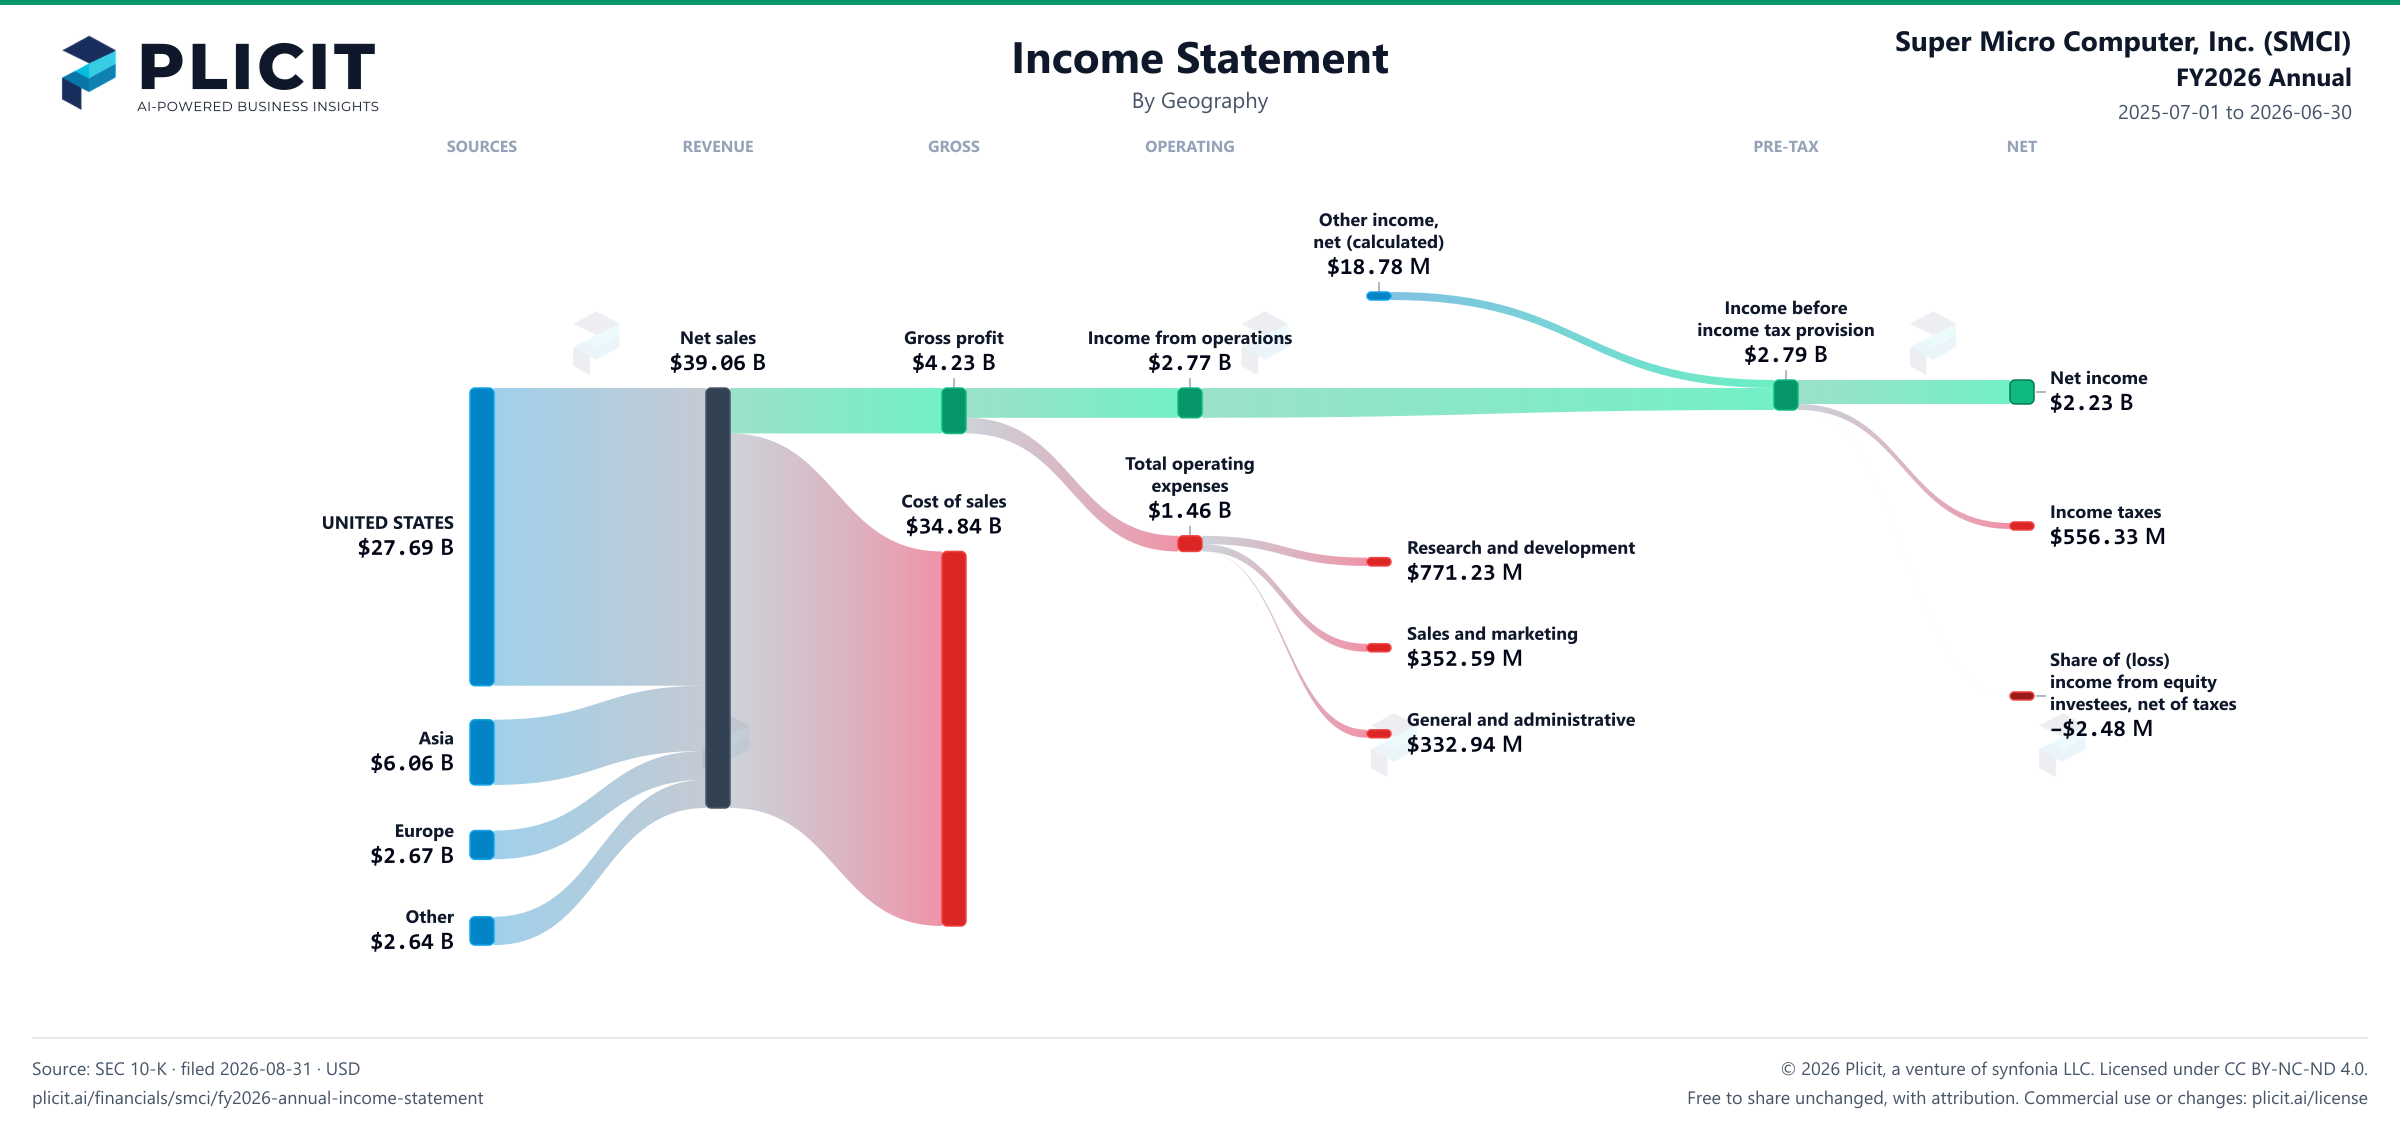
2025-07-01 to 2026-06-30

Revenue by Geography

Swipe to see the full flow
Super Micro Computer, Inc. (SMCI) FY2026 Annual P&L / Income StatementIncome statement for 2025-07-01 through 2026-06-30. View: Geography. Revenue uses this breakdown; costs and expenses retain the consolidated categories.SOURCESREVENUEGROSSOPERATINGPRE-TAXNETUNITED STATESAsiaEuropeOtherNet sales (including related party sales of $29,781, $42,259, and $69,791 in fiscal years 2026, 2025, and 2024, respectively)Gross profitCost of sales (including related party purchases of $725,694, $650,658, and $552,136 in fiscal years 2026, 2025, and 2024, respectively)Income from operationsTotal operating expensesResearch and developmentSales and marketingGeneral and administrativeOther income (expense), net (calculated)Income before income tax provisionNet incomeIncome tax provisionShare of (loss) income from equity investees, net of taxesOther income (expense), net (calculated)Other income,net (calculated)$18.78 MIncome before income tax provisionIncome beforeincome tax provision$2.79 BNet sales (including related party sales of $29,781, $42,259, and $69,791 in fiscal years 2026, 2025, and 2024, respectively)Net sales$39.06 BGross profitGross profit$4.23 BIncome from operationsIncome from operations$2.77 BNet incomeNet income$2.23 BTotal operating expensesTotal operatingexpenses$1.46 BCost of sales (including related party purchases of $725,694, $650,658, and $552,136 in fiscal years 2026, 2025, and 2024, respectively)Cost of sales$34.84 BIncome tax provisionIncome taxes$556.33 MUNITED STATESUNITED STATES$27.69 BResearch and developmentResearch and development$771.23 MSales and marketingSales and marketing$352.59 MShare of (loss) income from equity investees, net of taxesShare of (loss)income from equityinvestees, net of taxes−$2.48 MGeneral and administrativeGeneral and administrative$332.94 MAsiaAsia$6.06 BEuropeEurope$2.67 BOtherOther$2.64 B
Chart details

Super Micro Computer, Inc. (SMCI) FY2026 Annual P&L / Income Statement

Income statement for 2025-07-01 through 2026-06-30. View: Geography. Revenue uses this breakdown; costs and expenses retain the consolidated categories.

Net sales (including related party sales of $29,781, $42,259, and $69,791 in fiscal years 2026, 2025, and 2024, respectively)
39,063,072,000 US dollars
Cost of sales (including related party purchases of $725,694, $650,658, and $552,136 in fiscal years 2026, 2025, and 2024, respectively)
34,835,821,000 US dollars
Gross profit
4,227,251,000 US dollars
Total operating expenses
1,456,765,000 US dollars
Income from operations
2,770,486,000 US dollars
Other income (expense), net (calculated)
18,778,000 US dollars
Income before income tax provision
2,789,264,000 US dollars
Income tax provision
556,329,000 US dollars
Net income
2,230,453,000 US dollars
UNITED STATES
27,690,067,000 US dollars
Asia
6,063,327,000 US dollars
Europe
2,674,494,000 US dollars
Other
2,635,184,000 US dollars
Research and development
771,232,000 US dollars
Sales and marketing
352,594,000 US dollars
General and administrative
332,939,000 US dollars
Share of (loss) income from equity investees, net of taxes
negative 2,482,000 US dollars. Reported below-tax contribution to net income.

Chart connections

  • Revenue less cost of revenue equals gross profit; gross profit less operating expenses equals operating income.
  • Operating income plus other income or expense equals income before tax. Income before tax less income tax expense or benefit, plus the explicitly reported below-tax contributions, equals net income.
Super Micro Computer, Inc. (SMCI) FY2026 Annual Revenue by Geography Sankey chart
Free to share unchanged, with credit to Plicit.ai · CC BY-NC-ND 4.0Download PNG

Intelligent Insights for Investors

How much of Super Micro Computer, Inc.'s sales come from outside its home country?

A minority: 29% of its sales this year came from outside the United States, against 41% a year earlier. The filing says the split follows where products were shipped to.

Which parts of Super Micro Computer, Inc.'s sales by region drove the change over the past year?

Most of the growth came from one place: the United States. Of the $17.09 B rise in revenue this year, it supplied $14.64 B.

Are Super Micro Computer, Inc.'s foreign operations more or less profitable than its domestic business?

Less profitable abroad: operations outside the United States earned 15% of pretax income this year from 29% of sales. The two splits are measured on different bases, so they do not match exactly.

Intelligent Insights for Lenders

How much of Super Micro Computer, Inc.'s cash is held by foreign subsidiaries?

Super Micro held $870.5 million of its cash in foreign locations on June 30, 2026, against $607.2 million a year earlier. The filing says it does not expect restrictions or taxes on repatriating that cash to materially affect its liquidity.

Intelligent Insights for Everyone

Where in the world does Super Micro Computer, Inc. make its sales?

Mostly the United States: it supplied 71% of sales this year, and Asia, in second place, supplied 16%. Where sales come from shapes how currency swings and local economies touch the company.

Product waitlist

Health Check and Teardown for your own company

A health check uncovers insights of your private books, not a public ticker. Join this list to get notified as soon as we go-live!