
SNAP INC (SNAP) FY2026 Q2 Balance Sheet
As of 2026-06-30
Balance Sheet
As of 2026-06-30
Swipe to see the full flow
Chart details
SNAP INC (SNAP) FY2026 Q2 Balance Sheet
Balance sheet as of 2026-06-30. The chart shows assets, liabilities and equity at that date.
- Assets
- 7,470,160,000 US dollars
- Current assets
- 4,206,629,000 US dollars
- Non-current assets
- 3,263,531,000 US dollars
- Liabilities
- 5,543,072,000 US dollars
- Current liabilities
- 1,432,929,000 US dollars
- Non-current liabilities
- 4,110,143,000 US dollars
- Equity
- 1,927,088,000 US dollars
- Marketable securities
- 1,700,910,000 US dollars
- Accounts receivable, net of allowance
- 1,237,338,000 US dollars
- Cash and cash equivalents
- 958,848,000 US dollars
- Prepaid expenses and other current assets
- 309,533,000 US dollars
- Goodwill
- 1,780,133,000 US dollars
- Property and equipment, net
- 586,268,000 US dollars
- Operating lease right-of-use assets
- 562,091,000 US dollars
- Other assets
- 240,733,000 US dollars
- Intangible assets, net
- 94,306,000 US dollars
- Accrued expenses and other current liabilities
- 1,054,528,000 US dollars
- Accounts payable
- 177,419,000 US dollars
- Short-term debt, net
- 153,159,000 US dollars
- Operating lease liabilities
- 47,823,000 US dollars
- Long-term debt, net
- 3,381,448,000 US dollars
- Operating lease liabilities, noncurrent
- 643,317,000 US dollars
- Other liabilities
- 85,378,000 US dollars
- Additional paid-in capital
- 17,143,598,000 US dollars
- Accumulated other comprehensive income
- 8,741,000 US dollars
- Common stock, value - Class A non-voting common stock
- 15,000 US dollars
- Common stock, value - Class C voting common stock
- 2,000 US dollars
- Common stock, value - Class B voting common stock
- 0 US dollars
- Accumulated deficit
- negative 14,800,691,000 US dollars
- Treasury stock, at cost. 43,527 and 44,670 shares of Class A non-voting common stock at June 30, 2026 and December 31, 2025, respectively.
- negative 424,577,000 US dollars
- Gross equity (calculated)
- 17,152,356,000 US dollars. Net equity plus the magnitudes of its negative contributions equals gross positive equity. The negative contributions enter this reconciliation as add-backs; their filed signs stay negative.
Chart connections
- Assets equal liabilities plus consolidated equity. Consolidated equity includes noncontrolling interests when reported.
- Treasury shares and other negative equity contributions reduce equity.
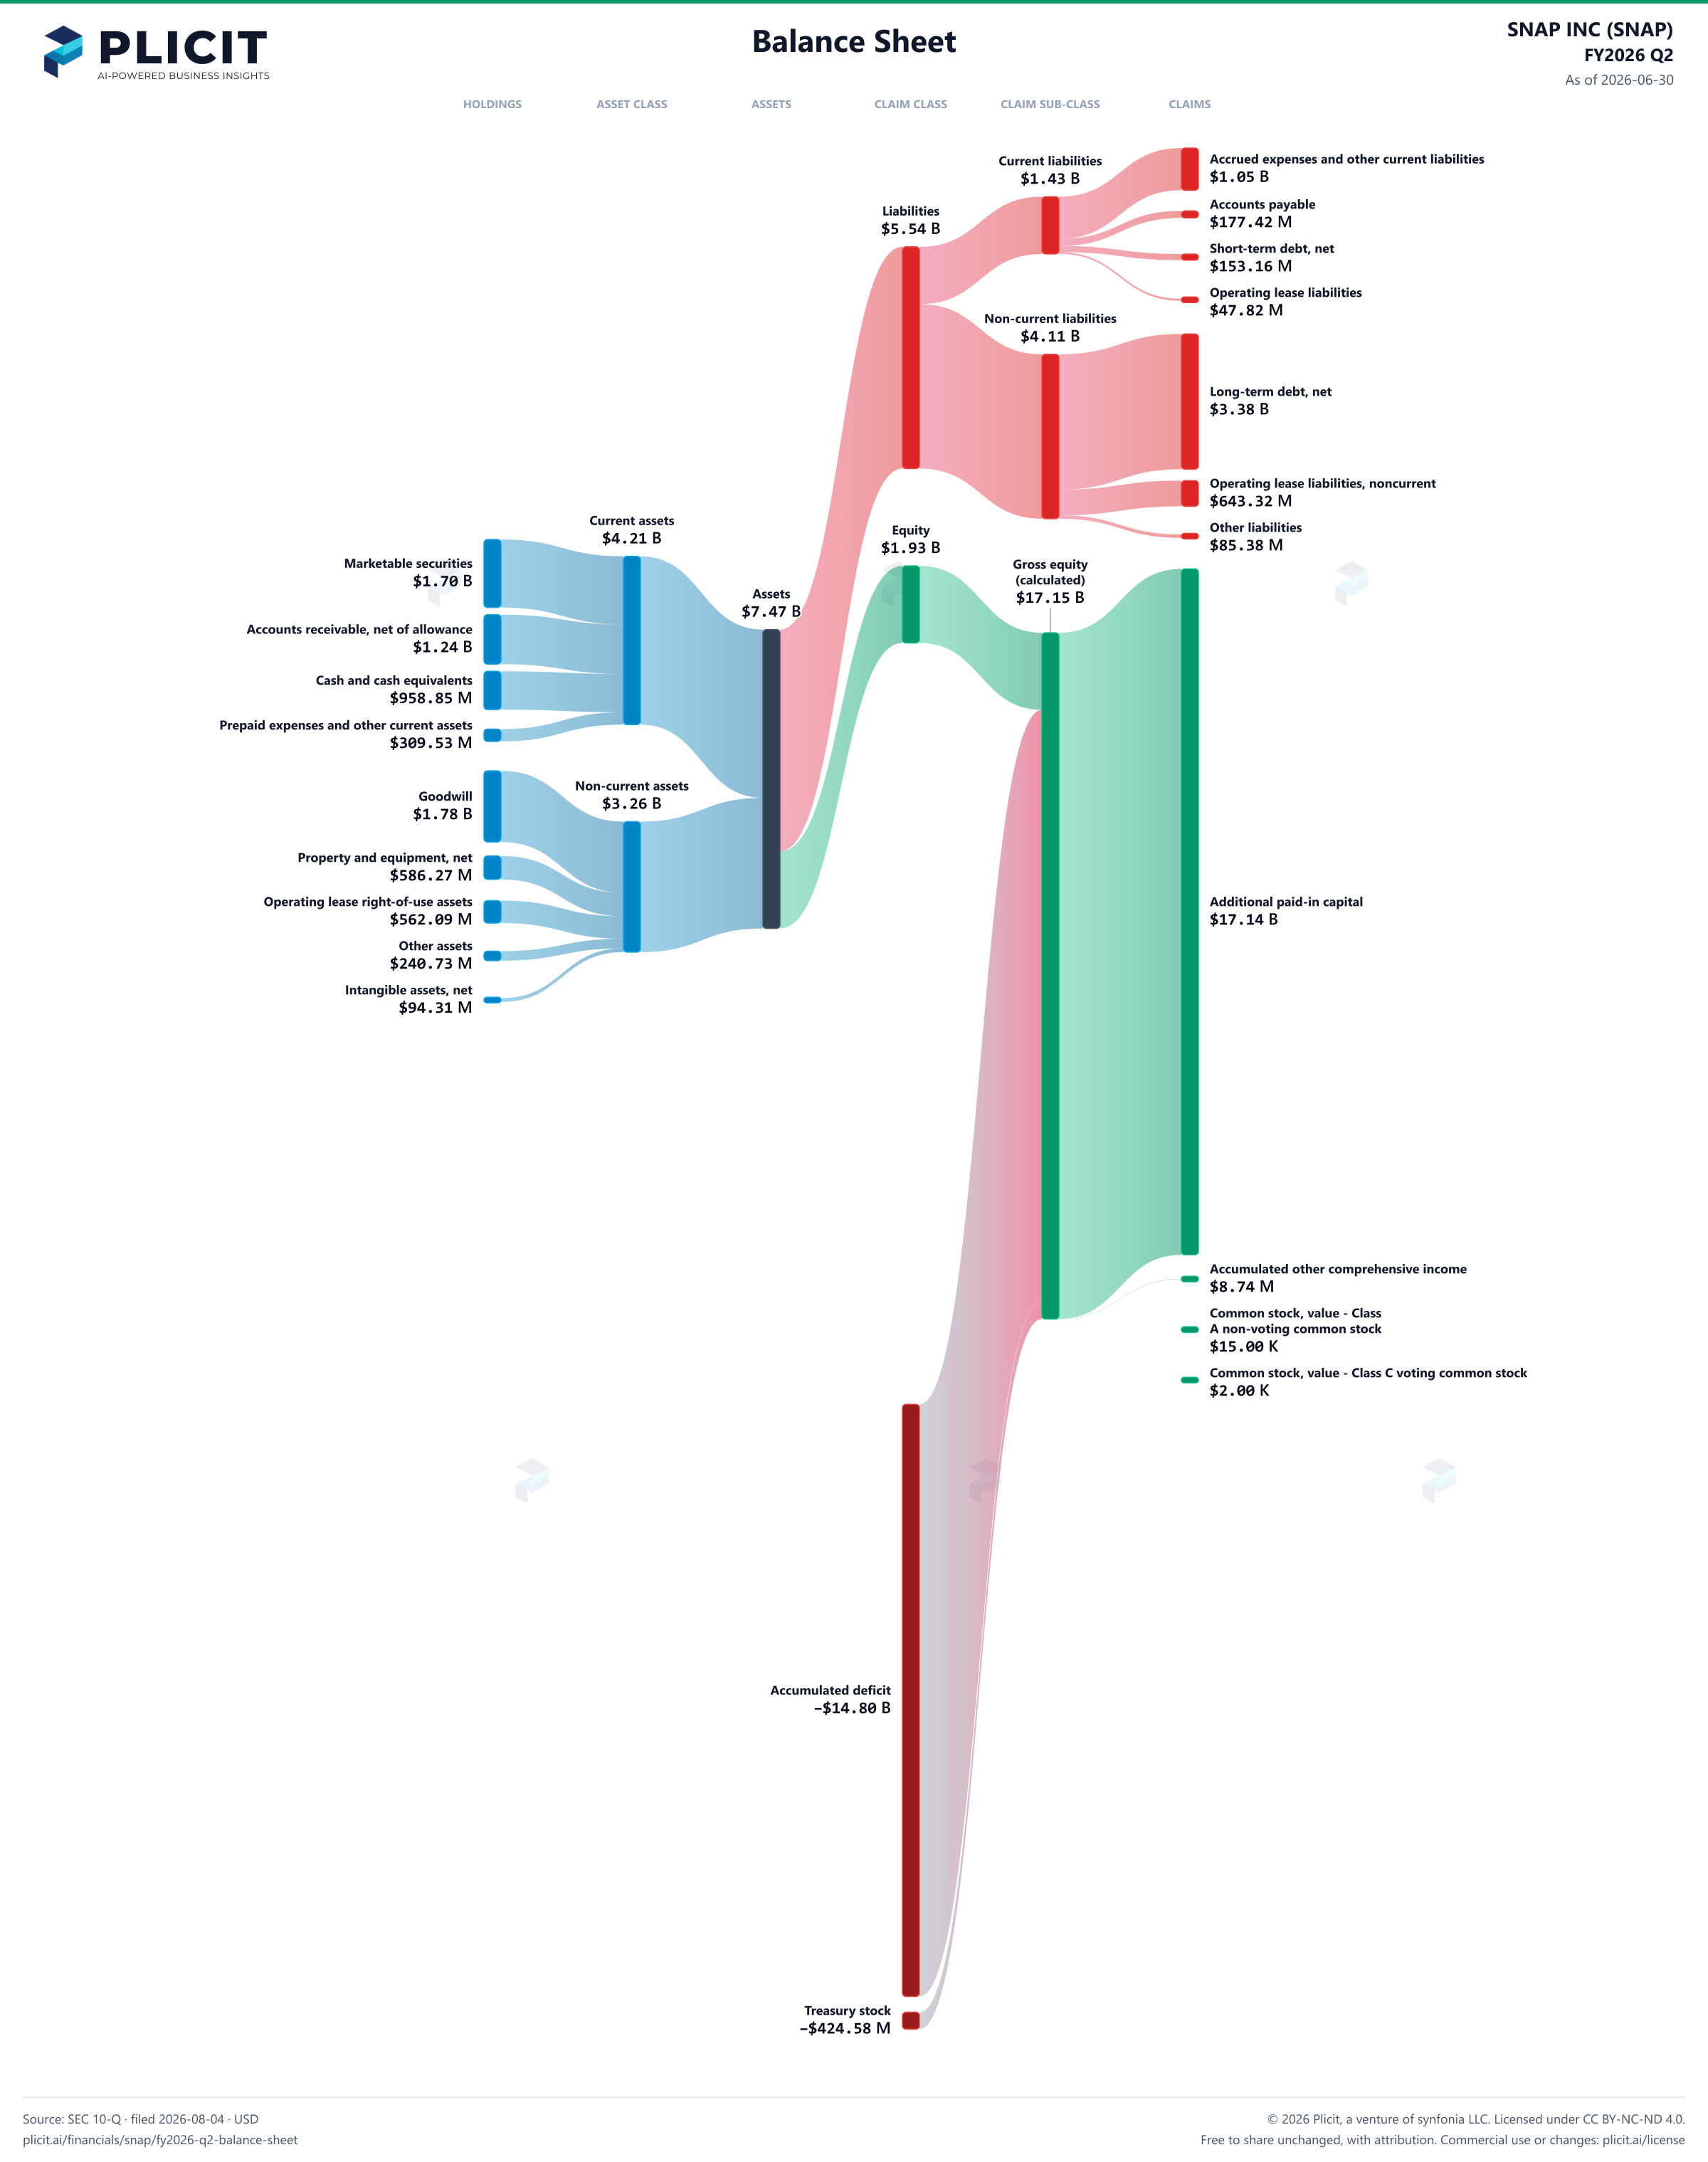
Free to share unchanged, with credit to Plicit.ai · CC BY-NC-ND 4.0Download PNG
Product waitlist
Health Check and Teardown for your own company
A health check uncovers insights of your private books, not a public ticker. Join this list to get notified as soon as we go-live!