
STATE STREET CORPORATION (STT) FY2025 Annual Balance Sheet
As of 2025-12-31
Balance Sheet
As of 2025-12-31
Swipe to see the full flow
Chart details
STATE STREET CORPORATION (STT) FY2025 Annual Balance Sheet
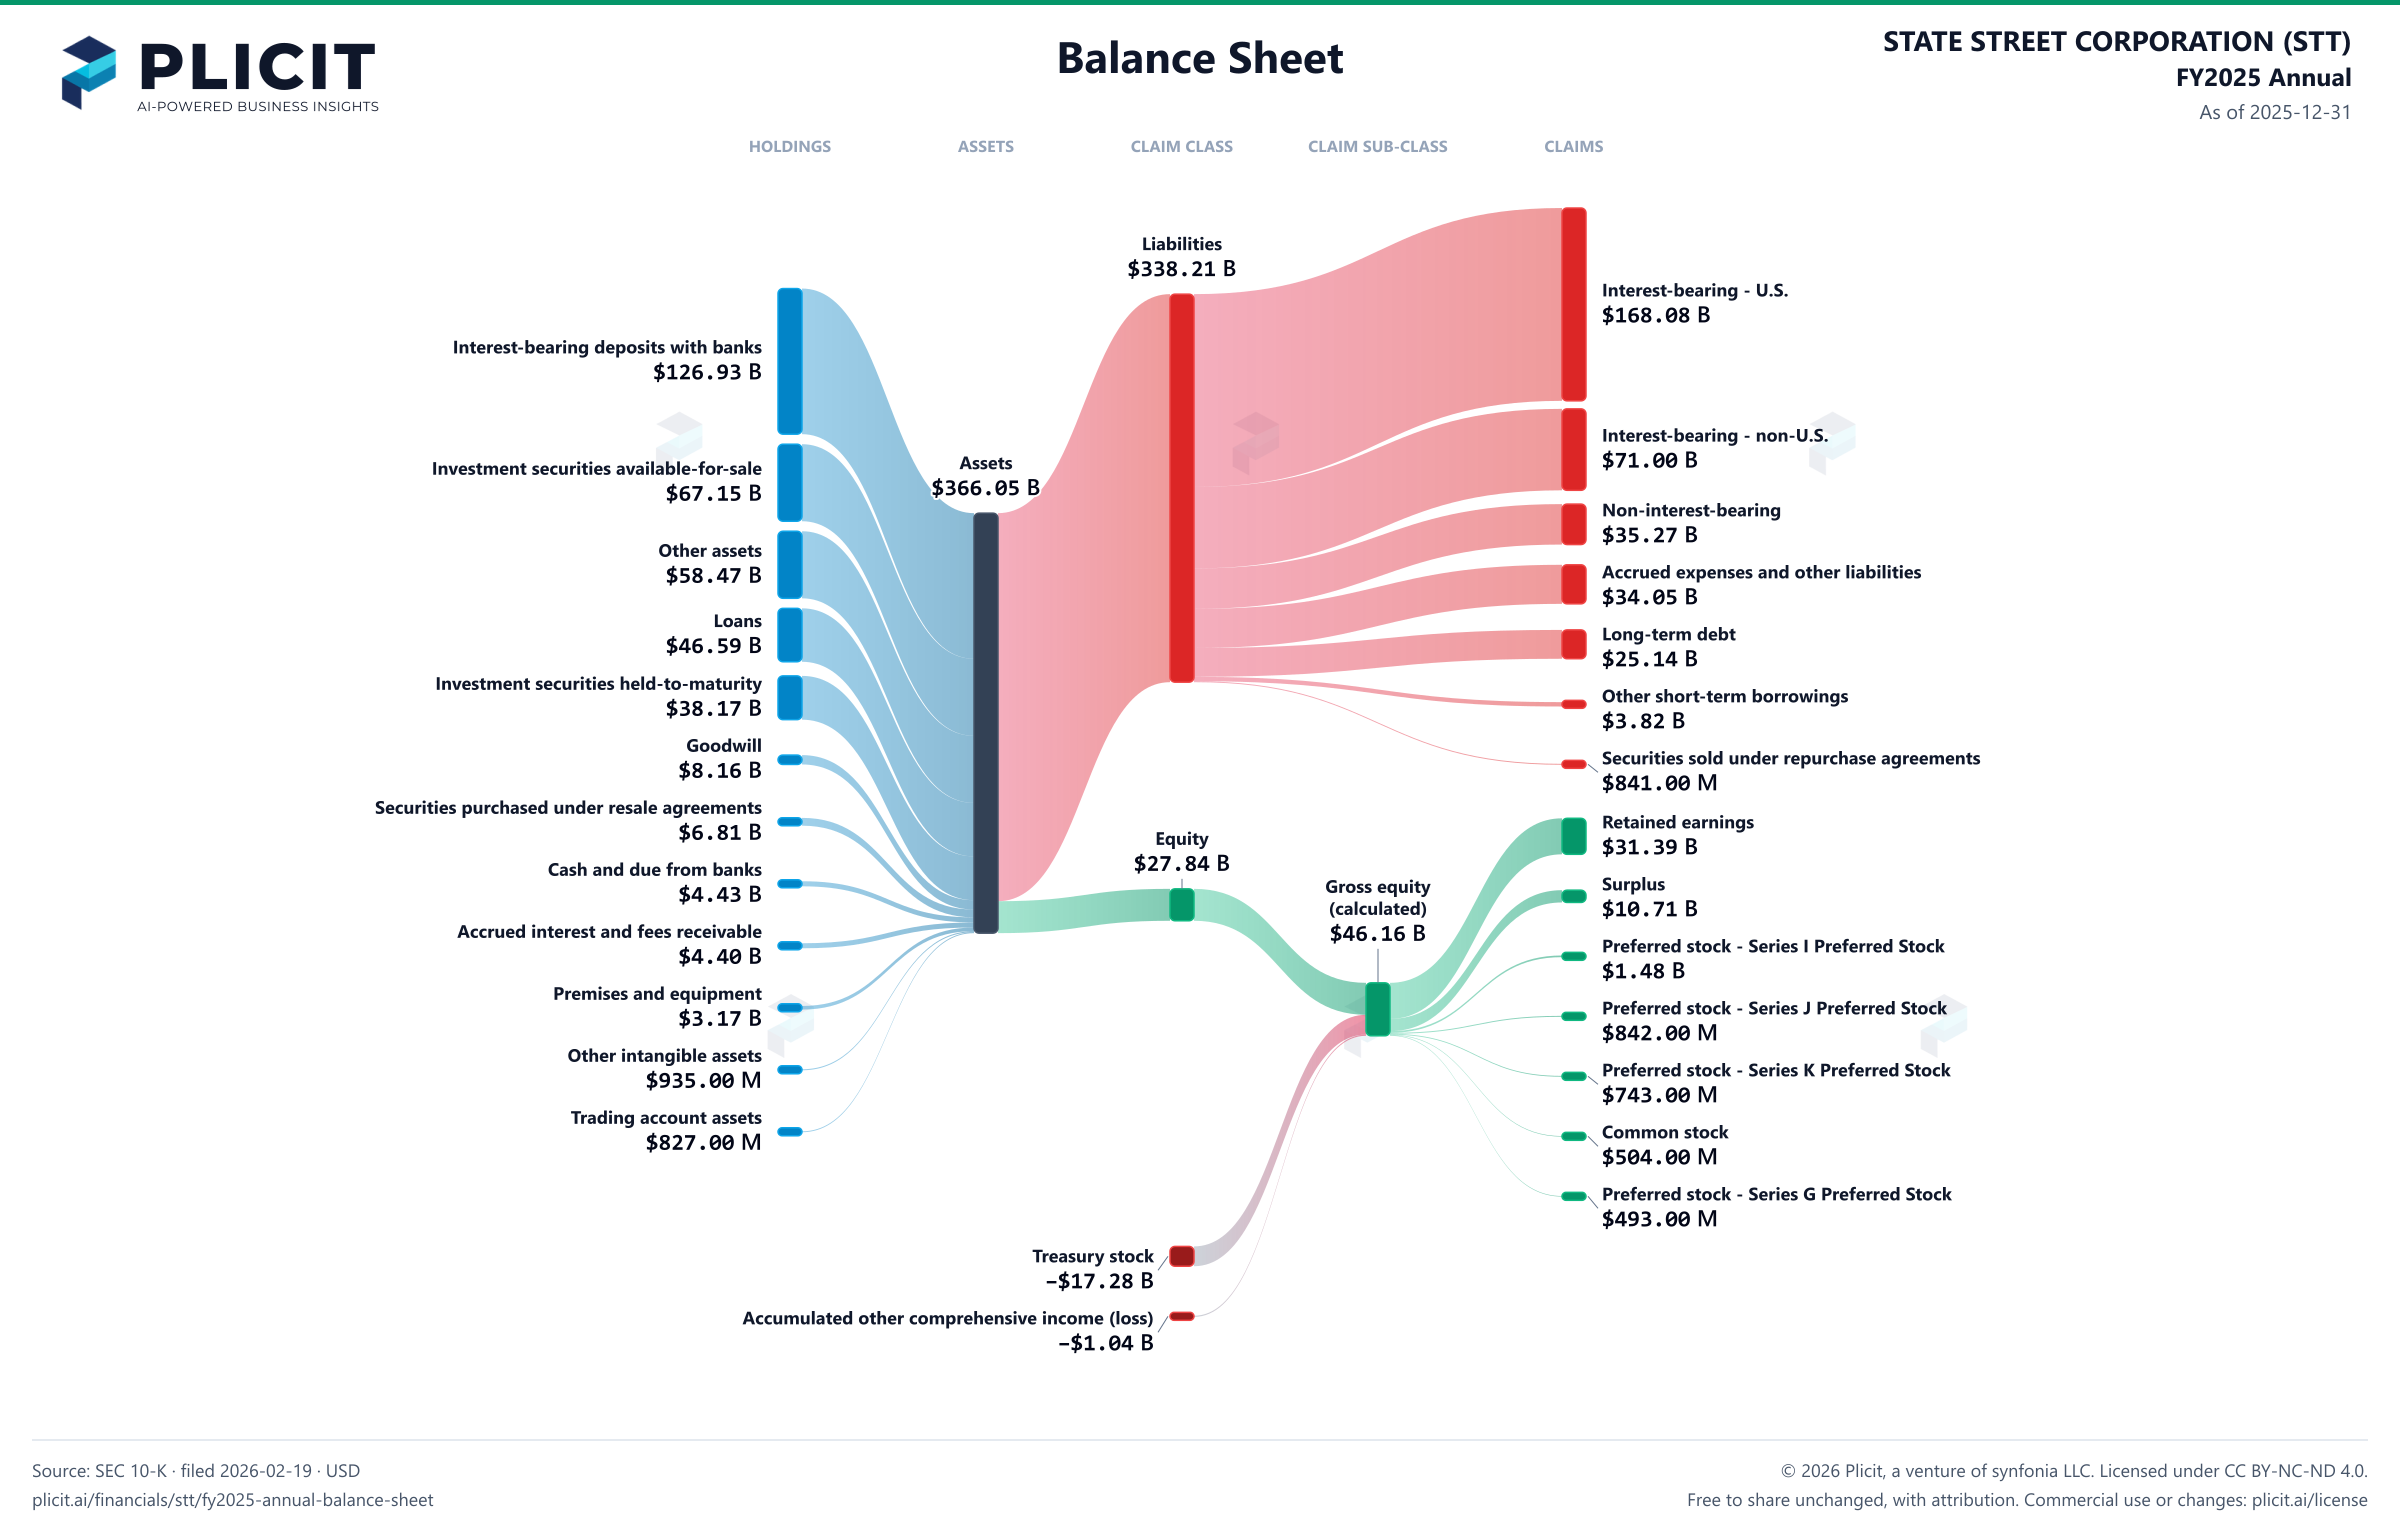
Balance sheet as of 2025-12-31. The chart shows assets, liabilities and equity at that date.
- Assets
- 366,047,000,000 US dollars
- Liabilities
- 338,206,000,000 US dollars
- Equity
- 27,841,000,000 US dollars
- Interest-bearing deposits with banks
- 126,930,000,000 US dollars
- Investment securities available-for-sale
- 67,154,000,000 US dollars
- Other assets
- 58,468,000,000 US dollars
- Loans (less allowance for credit losses on loans of $193 and $174)
- 46,589,000,000 US dollars
- Investment securities held-to-maturity (fair value of $34,166 and $41,906)
- 38,171,000,000 US dollars
- Goodwill
- 8,159,000,000 US dollars
- Securities purchased under resale agreements
- 6,812,000,000 US dollars
- Cash and due from banks
- 4,433,000,000 US dollars
- Accrued interest and fees receivable
- 4,395,000,000 US dollars
- Premises and equipment (net of accumulated depreciation of $7,046 and $6,461)
- 3,174,000,000 US dollars
- Other intangible assets
- 935,000,000 US dollars
- Trading account assets
- 827,000,000 US dollars
- Interest-bearing - U.S.
- 168,079,000,000 US dollars
- Interest-bearing - non-U.S.
- 71,004,000,000 US dollars
- Non-interest-bearing
- 35,267,000,000 US dollars
- Accrued expenses and other liabilities
- 34,051,000,000 US dollars
- Long-term debt
- 25,143,000,000 US dollars
- Other short-term borrowings
- 3,821,000,000 US dollars
- Securities sold under repurchase agreements
- 841,000,000 US dollars
- Retained earnings
- 31,392,000,000 US dollars
- Surplus
- 10,705,000,000 US dollars
- Preferred stock - Series I Preferred Stock
- 1,481,000,000 US dollars
- Preferred stock - Series J Preferred Stock
- 842,000,000 US dollars
- Preferred stock - Series K Preferred Stock
- 743,000,000 US dollars
- Common stock
- 504,000,000 US dollars
- Preferred stock - Series G Preferred Stock
- 493,000,000 US dollars
- Treasury stock, at cost (224,801,735 and 215,113,190 shares)
- negative 17,276,000,000 US dollars
- Accumulated other comprehensive income (loss)
- negative 1,043,000,000 US dollars
- Gross equity (calculated)
- 46,160,000,000 US dollars. Net equity plus the magnitudes of its negative contributions equals gross positive equity. The negative contributions enter this reconciliation as add-backs; their filed signs stay negative.
Chart connections
- Assets equal liabilities plus consolidated equity. Consolidated equity includes noncontrolling interests when reported.
- Treasury shares and other negative equity contributions reduce equity.
Free to share unchanged, with credit to Plicit.ai · CC BY-NC-ND 4.0Download PNG
Product waitlist
Health Check and Teardown for your own company
A health check uncovers insights of your private books, not a public ticker. Join this list to get notified as soon as we go-live!