
STATE STREET CORPORATION (STT) FY2025 Q1 Balance Sheet

Balance Sheet

As of 2025-03-31

Swipe to see the full flow
STATE STREET CORPORATION (STT) FY2025 Q1 Balance SheetBalance sheet as of 2025-03-31. The chart shows assets, liabilities and equity at that date.Liabilities$346.00 BAssets$372.69 BEquity$26.69 BGross equity(calculated)$44.72 BHOLDINGSASSETSCLAIM CLASSCLAIM SUB-CLASSCLAIMSInterest-bearing deposits with banksInvestment securities available-for-saleOther assetsInvestment securities held-to-maturity (less allowance for credit losses of $0 and $0) (fair value of $40,424 and $41,906)Loans (less allowance for credit losses on loans of $176 and $174)Securities purchased under resale agreementsGoodwillCash and due from banksAccrued interest and fees receivablePremises and equipment (net of accumulated depreciation of $6,635 and $6,461)Other intangible assetsTrading account assetsInterest-bearing - U.S.Interest-bearing - non-U.S.Accrued expenses and other liabilitiesNon-interest-bearingLong-term debtOther short-term borrowingsSecurities sold under repurchase agreementsRetained earningsSurplusPreferred stock, no par, 3,500,000 shares authorized - Series I Preferred StockPreferred stock, no par, 3,500,000 shares authorized - Series J Preferred StockPreferred stock, no par, 3,500,000 shares authorized - Series K Preferred StockCommon stock, $1 par, 750,000,000 shares authorized:Preferred stock, no par, 3,500,000 shares authorized - Series G Preferred StockAssetsLiabilitiesEquityGross equity (calculated)Treasury stock, at cost (215,203,413 and 215,113,190 shares)Accumulated other comprehensive income (loss)LiabilitiesLiabilities$346.00 BInterest-bearing - U.S.Interest-bearing - U.S.$168.36 BInterest-bearing deposits with banksInterest-bearing deposits with banks$119.46 BInterest-bearing - non-U.S.Interest-bearing - non-U.S.$71.43 BInvestment securities available-for-saleInvestment securities available-for-sale$67.44 BAssetsAssets$372.69 BAccrued expenses and other liabilitiesAccrued expenses and other liabilities$33.73 BOther assetsOther assets$66.53 BNon-interest-bearingNon-interest-bearing$32.27 BInvestment securities held-to-maturity (less allowance for credit losses of $0 and $0) (fair value of $40,424 and $41,906)Investment securities held-to-maturity$45.51 BLong-term debtLong-term debt$24.85 BLoans (less allowance for credit losses on loans of $176 and $174)Loans$44.51 BOther short-term borrowingsOther short-term borrowings$11.85 BSecurities purchased under resale agreementsSecurities purchased under resale agreements$7.97 BSecurities sold under repurchase agreementsSecurities sold under repurchase agreements$3.52 BGoodwillGoodwill$7.76 BRetained earningsRetained earnings$29.96 BEquityEquity$26.69 BCash and due from banksCash and due from banks$4.66 BSurplusSurplus$10.69 BGross equity (calculated)Gross equity(calculated)$44.72 BAccrued interest and fees receivableAccrued interest and fees receivable$4.28 BPreferred stock, no par, 3,500,000 shares authorized - Series I Preferred StockSeries I Preferred Stock$1.48 BPremises and equipment (net of accumulated depreciation of $6,635 and $6,461)Premises and equipment$2.78 BPreferred stock, no par, 3,500,000 shares authorized - Series J Preferred StockSeries J Preferred Stock$842.00 MOther intangible assetsOther intangible assets$1.05 BPreferred stock, no par, 3,500,000 shares authorized - Series K Preferred StockSeries K Preferred Stock$743.00 MTrading account assetsTrading account assets$743.00 MCommon stock, $1 par, 750,000,000 shares authorized:Common stock, $1 par, 750,000,000 shares authorized:$504.00 MPreferred stock, no par, 3,500,000 shares authorized - Series G Preferred StockSeries G Preferred Stock$493.00 MTreasury stock, at cost (215,203,413 and 215,113,190 shares)Treasury stock−$16.23 BAccumulated other comprehensive income (loss)Accumulated other comprehensive income (loss)−$1.79 B
Chart details

STATE STREET CORPORATION (STT) FY2025 Q1 Balance Sheet

Balance sheet as of 2025-03-31. The chart shows assets, liabilities and equity at that date.

Assets
372,693,000,000 US dollars
Liabilities
346,001,000,000 US dollars
Equity
26,692,000,000 US dollars
Interest-bearing deposits with banks
119,464,000,000 US dollars
Investment securities available-for-sale
67,444,000,000 US dollars
Other assets
66,526,000,000 US dollars
Investment securities held-to-maturity (less allowance for credit losses of $0 and $0) (fair value of $40,424 and $41,906)
45,505,000,000 US dollars
Loans (less allowance for credit losses on loans of $176 and $174)
44,509,000,000 US dollars
Securities purchased under resale agreements
7,971,000,000 US dollars
Goodwill
7,763,000,000 US dollars
Cash and due from banks
4,658,000,000 US dollars
Accrued interest and fees receivable
4,280,000,000 US dollars
Premises and equipment (net of accumulated depreciation of $6,635 and $6,461)
2,784,000,000 US dollars
Other intangible assets
1,046,000,000 US dollars
Trading account assets
743,000,000 US dollars
Interest-bearing - U.S.
168,362,000,000 US dollars
Interest-bearing - non-U.S.
71,429,000,000 US dollars
Accrued expenses and other liabilities
33,726,000,000 US dollars
Non-interest-bearing
32,265,000,000 US dollars
Long-term debt
24,846,000,000 US dollars
Other short-term borrowings
11,849,000,000 US dollars
Securities sold under repurchase agreements
3,524,000,000 US dollars
Retained earnings
29,959,000,000 US dollars
Surplus
10,693,000,000 US dollars
Preferred stock, no par, 3,500,000 shares authorized - Series I Preferred Stock
1,481,000,000 US dollars
Preferred stock, no par, 3,500,000 shares authorized - Series J Preferred Stock
842,000,000 US dollars
Preferred stock, no par, 3,500,000 shares authorized - Series K Preferred Stock
743,000,000 US dollars
Common stock, $1 par, 750,000,000 shares authorized:
504,000,000 US dollars
Preferred stock, no par, 3,500,000 shares authorized - Series G Preferred Stock
493,000,000 US dollars
Treasury stock, at cost (215,203,413 and 215,113,190 shares)
negative 16,231,000,000 US dollars
Accumulated other comprehensive income (loss)
negative 1,792,000,000 US dollars
Gross equity (calculated)
44,715,000,000 US dollars. Net equity plus the magnitudes of its negative contributions equals gross positive equity. The negative contributions enter this reconciliation as add-backs; their filed signs stay negative.

Chart connections

  • Assets equal liabilities plus consolidated equity. Consolidated equity includes noncontrolling interests when reported.
  • Treasury shares and other negative equity contributions reduce equity.
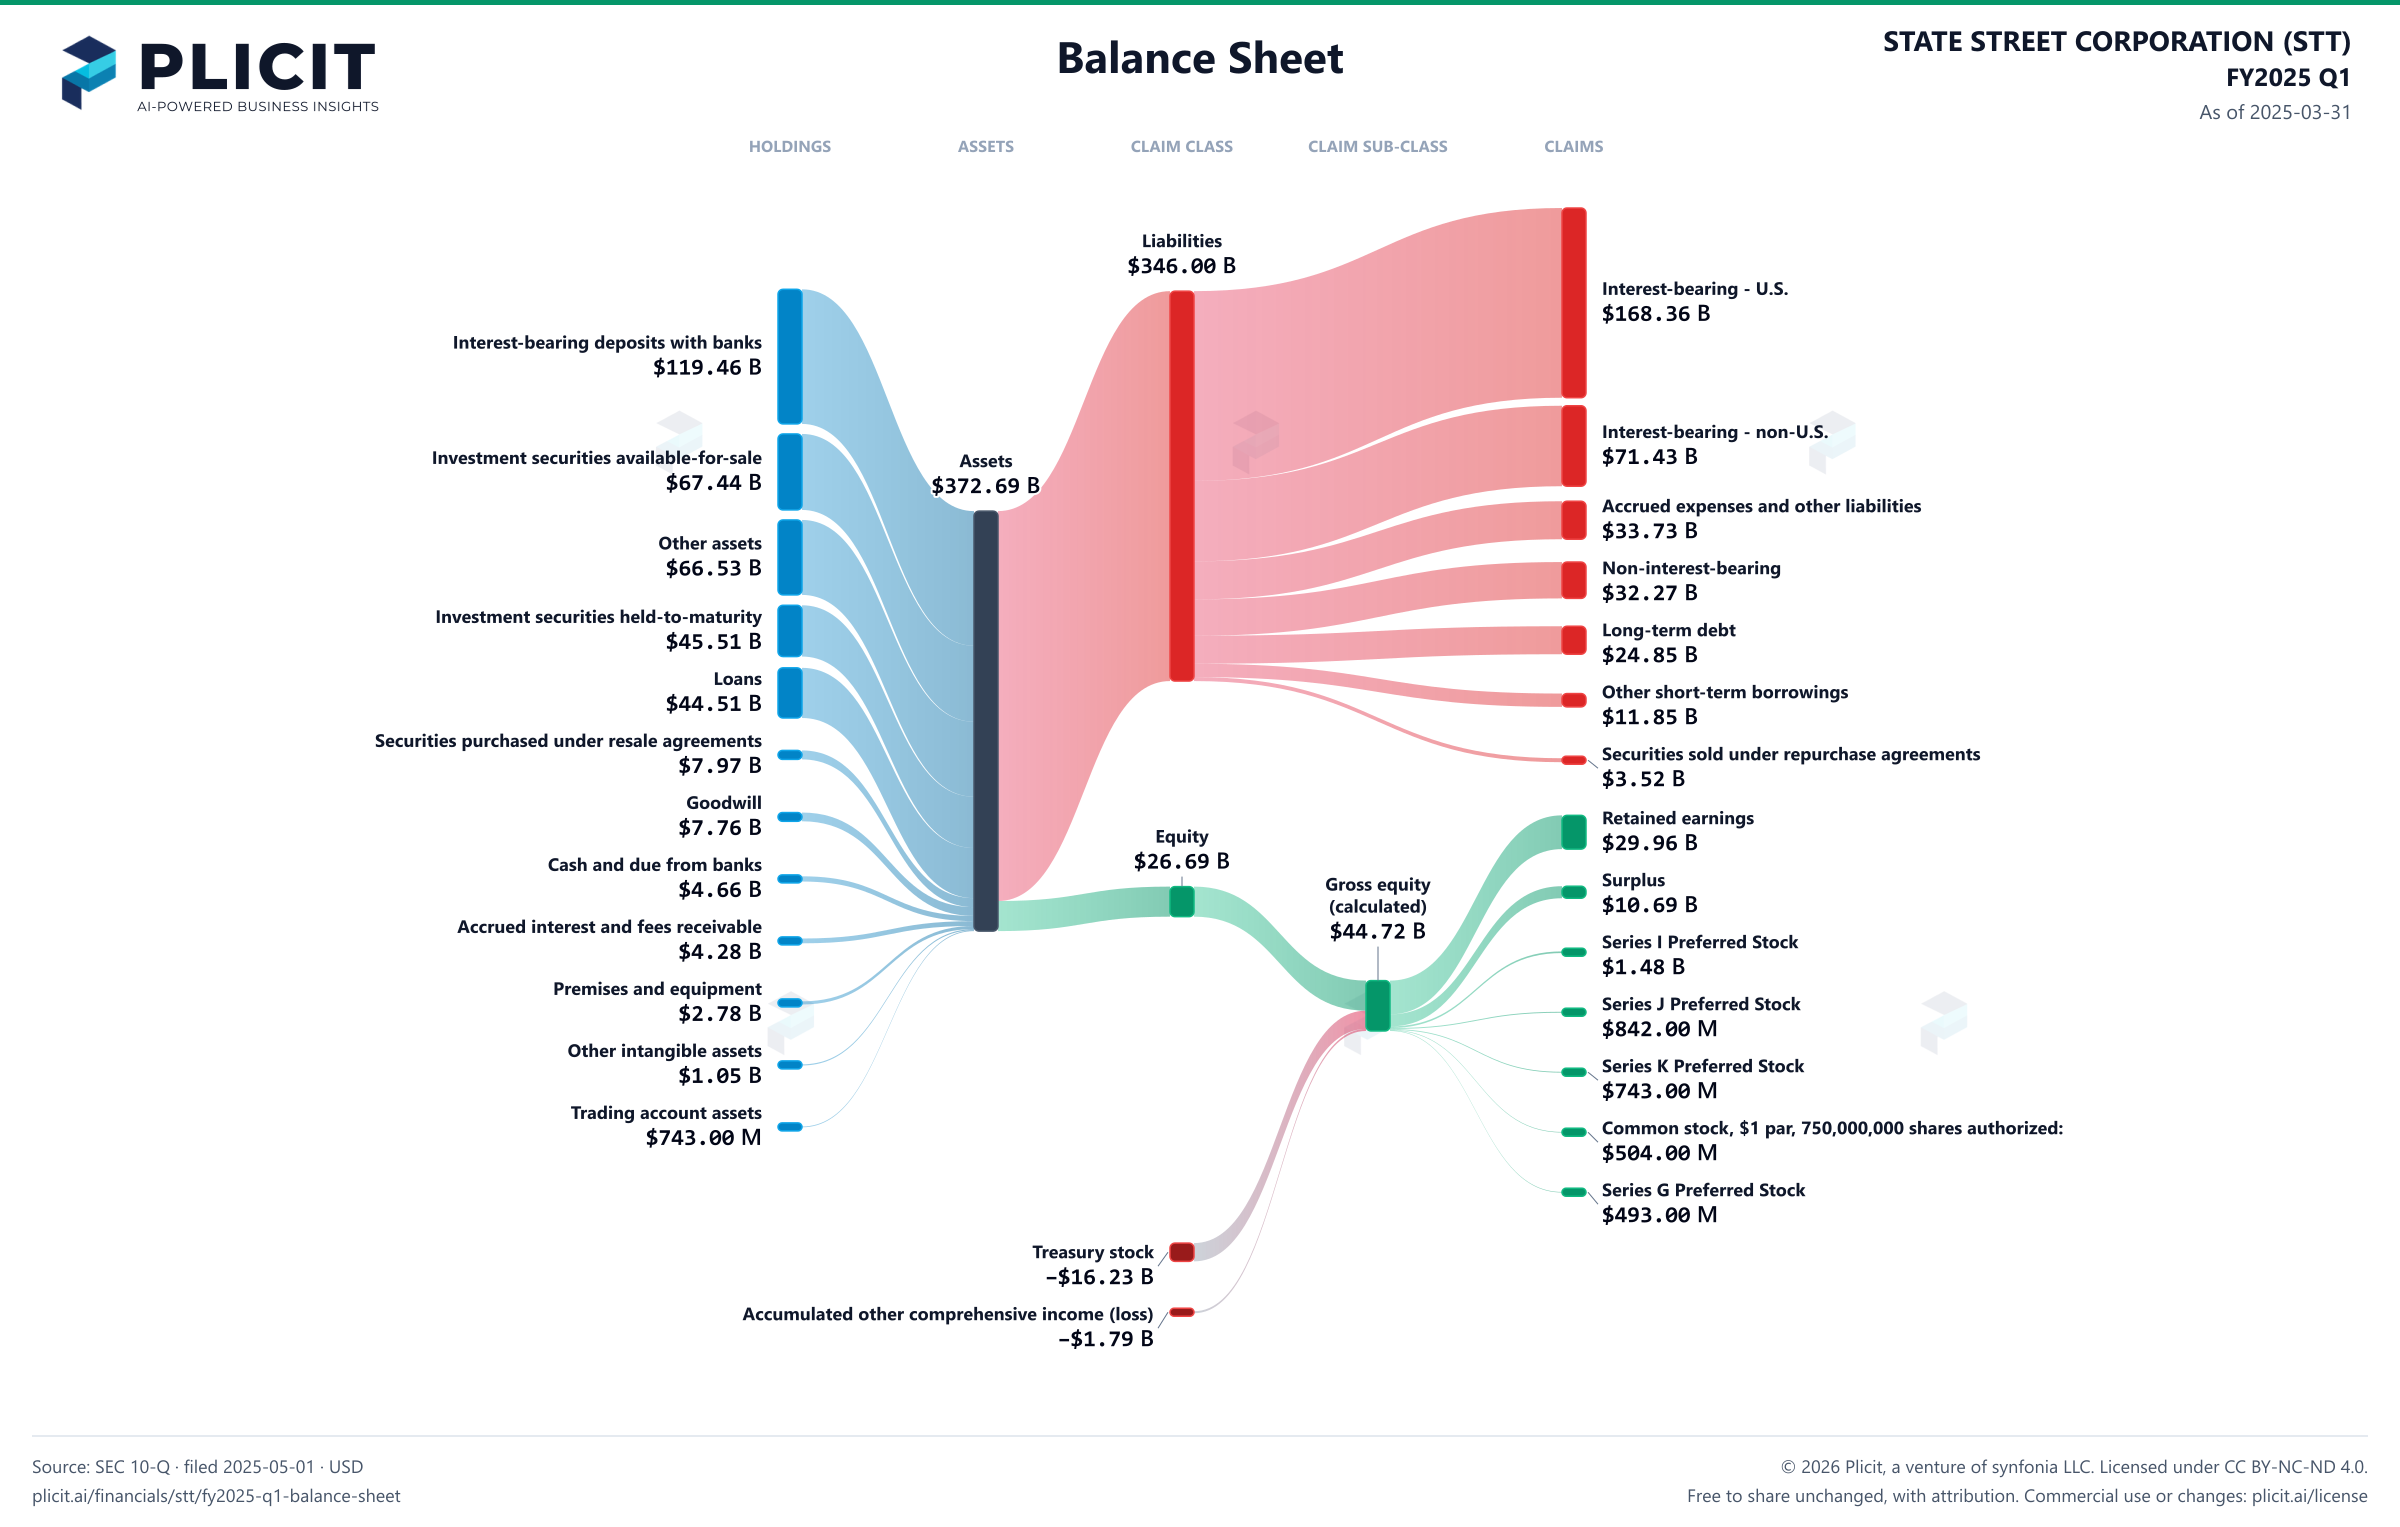
STATE STREET CORPORATION (STT) FY2025 Q1 Balance Sheet Sankey chart
Free to share unchanged, with credit to Plicit.ai · CC BY-NC-ND 4.0Download PNG

Newsletter

Get the teardowns by email

Subscribe if you want the public-company teardowns in your inbox when they're released.

Product waitlist

Health Check and Teardown for your own company

A health check uncovers insights of your private books, not a public ticker. Join this list to get notified as soon as we go-live!