
T-MOBILE US, INC. (TMUS) FY2024 Q1 Balance Sheet

Balance Sheet

As of 2024-03-31

Swipe to see the full flow
T-MOBILE US, INC. (TMUS) FY2024 Q1 Balance SheetBalance sheet as of 2024-03-31. The chart shows assets, liabilities and equity at that date.Current liabilities$20.56 BCurrent assets$19.30 BLiabilities(calculated)$144.19 BAssets$206.27 BNon-current liabilities$123.63 BNon-current assets$186.97 BEquity$62.07 BGross equity(calculated)$75.98 BHOLDINGSASSET CLASSASSETSCLAIM CLASSCLAIM SUB-CLASSCLAIMSCash and cash equivalentsAccounts receivable, net of allowance for credit losses of $161 and $161Equipment installment plan receivables, net of allowance for credit losses and imputed discount of $614 and $623Other current assetsInventoryPrepaid expensesSpectrum licensesProperty and equipment, netOperating lease right-of-use assetsGoodwillOther assetsFinancing lease right-of-use assetsOther intangible assets, netEquipment installment plan receivables due after one year, net of allowance for credit losses and imputed discount of $143 and $150Accounts payable and accrued liabilitiesShort-term debtShort-term operating lease liabilitiesOther current liabilitiesShort-term financing lease liabilitiesDeferred revenueLong-term debt - Nonrelated PartyOperating lease liabilitiesDeferred tax liabilitiesOther long-term liabilitiesTower obligationsLong-term debt - Related PartyFinancing lease liabilitiesAdditional paid-in capitalRetained earningsCurrent assetsNon-current assetsAssetsCurrent liabilitiesNon-current liabilitiesLiabilities (calculated)EquityGross equity (calculated)Treasury stock, at cost, 89,053,922 and 67,096,823 sharesAccumulated other comprehensive lossAccounts payable and accrued liabilitiesAccounts payable and accrued liabilities$7.72 BCash and cash equivalentsCash and cash equivalents$6.71 BShort-term debtShort-term debt$5.36 BAccounts receivable, net of allowance for credit losses of $161 and $161Receivables, net$4.25 BCurrent liabilitiesCurrent liabilities$20.56 BShort-term operating lease liabilitiesShort-term operating lease liabilities$3.44 BCurrent assetsCurrent assets$19.30 BEquipment installment plan receivables, net of allowance for credit losses and imputed discount of $614 and $623Equipment installment plan receivables, net$4.06 BOther current liabilitiesOther current liabilities$1.93 BOther current assetsOther current assets$2.04 BLiabilities (calculated)Liabilities(calculated)$144.19 BShort-term financing lease liabilitiesShort-term financing lease liabilities$1.27 BInventoryInventory$1.52 BAssetsAssets$206.27 BDeferred revenueDeferred revenue$846.00 MPrepaid expensesPrepaid expenses$715.00 MLong-term debt - Nonrelated PartyLong-term debt - Nonrelated Party$71.36 BNon-current liabilitiesNon-current liabilities$123.63 BSpectrum licensesSpectrum licenses$97.15 BNon-current assetsNon-current assets$186.97 BOperating lease liabilitiesOperating lease liabilities$27.83 BDeferred tax liabilitiesDeferred tax liabilities$14.19 BProperty and equipment, netProperty and equipment, net$39.29 BOther long-term liabilitiesOther long-term liabilities$3.85 BEquityEquity$62.07 BOperating lease right-of-use assetsOperating lease right-of-use assets$26.77 BTower obligationsTower obligations$3.75 BLong-term debt - Related PartyLong-term debt - Related Party$1.50 BGoodwillGoodwill$12.23 BFinancing lease liabilitiesFinancing lease liabilities$1.16 BGross equity (calculated)Gross equity(calculated)$75.98 BOther assetsOther assets$4.00 BFinancing lease right-of-use assetsFinancing lease right-of-use assets$3.18 BAdditional paid-in capitalAdditional paid-in capital$67.79 BOther intangible assets, netOther intangible assets, net$2.45 BEquipment installment plan receivables due after one year, net of allowance for credit losses and imputed discount of $143 and $150Equipment installment planreceivables due after one year, net$1.91 BRetained earningsRetained earnings$8.20 BTreasury stock, at cost, 89,053,922 and 67,096,823 sharesTreasury stock−$12.98 BAccumulated other comprehensive lossAccumulated other comprehensive loss−$926.00 M
Chart details

T-MOBILE US, INC. (TMUS) FY2024 Q1 Balance Sheet

Balance sheet as of 2024-03-31. The chart shows assets, liabilities and equity at that date.

Assets
206,268,000,000 US dollars
Current assets
19,295,000,000 US dollars
Non-current assets
186,973,000,000 US dollars
Liabilities (calculated)
144,194,000,000 US dollars
Current liabilities
20,563,000,000 US dollars
Non-current liabilities
123,631,000,000 US dollars
Equity
62,074,000,000 US dollars
Cash and cash equivalents
6,708,000,000 US dollars
Accounts receivable, net of allowance for credit losses of $161 and $161
4,253,000,000 US dollars
Equipment installment plan receivables, net of allowance for credit losses and imputed discount of $614 and $623
4,059,000,000 US dollars
Other current assets
2,039,000,000 US dollars
Inventory
1,521,000,000 US dollars
Prepaid expenses
715,000,000 US dollars
Spectrum licenses
97,154,000,000 US dollars
Property and equipment, net
39,286,000,000 US dollars
Operating lease right-of-use assets
26,766,000,000 US dollars
Goodwill
12,234,000,000 US dollars
Other assets
4,000,000,000 US dollars
Financing lease right-of-use assets
3,180,000,000 US dollars
Other intangible assets, net
2,445,000,000 US dollars
Equipment installment plan receivables due after one year, net of allowance for credit losses and imputed discount of $143 and $150
1,908,000,000 US dollars
Accounts payable and accrued liabilities
7,720,000,000 US dollars
Short-term debt
5,356,000,000 US dollars
Short-term operating lease liabilities
3,443,000,000 US dollars
Other current liabilities
1,933,000,000 US dollars
Short-term financing lease liabilities
1,265,000,000 US dollars
Deferred revenue
846,000,000 US dollars
Long-term debt - Nonrelated Party
71,361,000,000 US dollars
Operating lease liabilities
27,827,000,000 US dollars
Deferred tax liabilities
14,187,000,000 US dollars
Other long-term liabilities
3,846,000,000 US dollars
Tower obligations
3,751,000,000 US dollars
Long-term debt - Related Party
1,496,000,000 US dollars
Financing lease liabilities
1,163,000,000 US dollars
Additional paid-in capital
67,786,000,000 US dollars
Retained earnings
8,196,000,000 US dollars
Common stock, par value $0.00001 per share, 2,000,000,000 shares authorized; 1,266,294,032 and 1,262,904,154 shares issued, 1,177,240,110 and 1,195,807,331 shares outstanding
0 US dollars
Treasury stock, at cost, 89,053,922 and 67,096,823 shares
negative 12,982,000,000 US dollars
Accumulated other comprehensive loss
negative 926,000,000 US dollars
Gross equity (calculated)
75,982,000,000 US dollars. Net equity plus the magnitudes of its negative contributions equals gross positive equity. The negative contributions enter this reconciliation as add-backs; their filed signs stay negative.

Chart connections

  • Assets equal liabilities plus consolidated equity. Consolidated equity includes noncontrolling interests when reported.
  • Treasury shares and other negative equity contributions reduce equity.
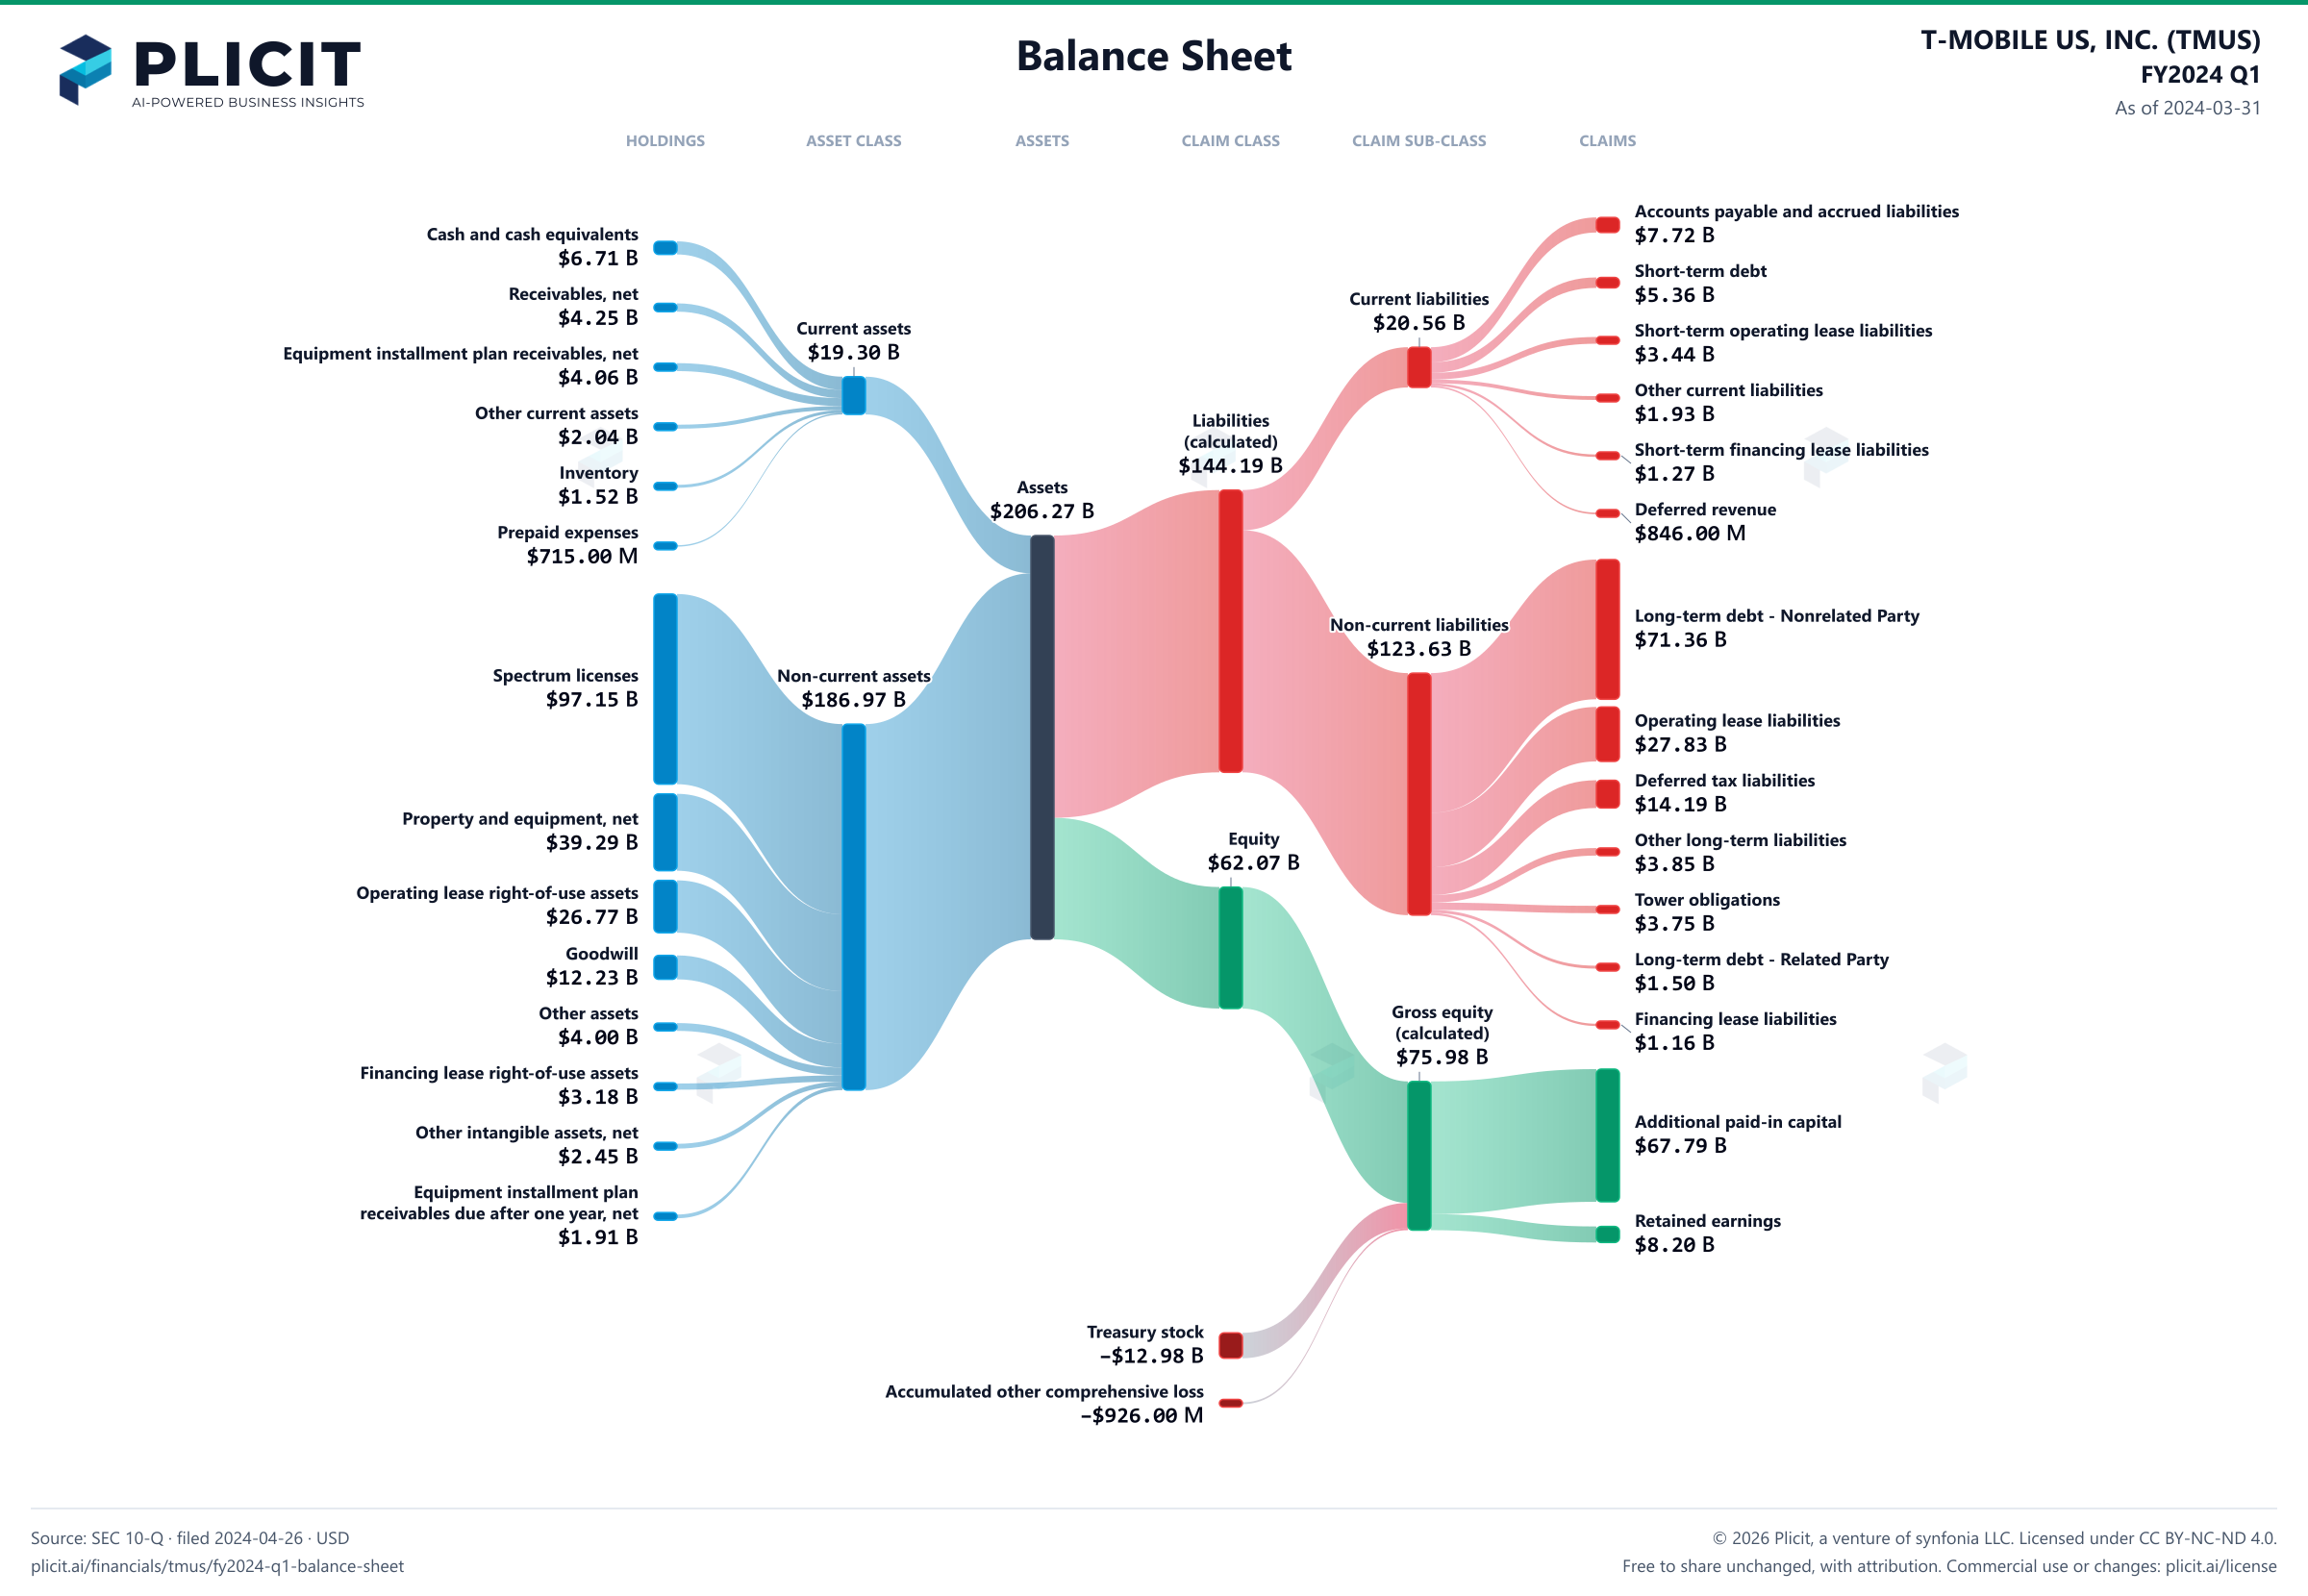
T-MOBILE US, INC. (TMUS) FY2024 Q1 Balance Sheet Sankey chart
Free to share unchanged, with credit to Plicit.ai · CC BY-NC-ND 4.0Download PNG

Newsletter

Get the teardowns by email

Subscribe if you want the public-company teardowns in your inbox when they're released.

Product waitlist

Health Check and Teardown for your own company

A health check uncovers insights of your private books, not a public ticker. Join this list to get notified as soon as we go-live!