
T-MOBILE US, INC. (TMUS) FY2024 Q3 Balance Sheet
As of 2024-09-30
Balance Sheet
As of 2024-09-30
Swipe to see the full flow
Chart details
T-MOBILE US, INC. (TMUS) FY2024 Q3 Balance Sheet
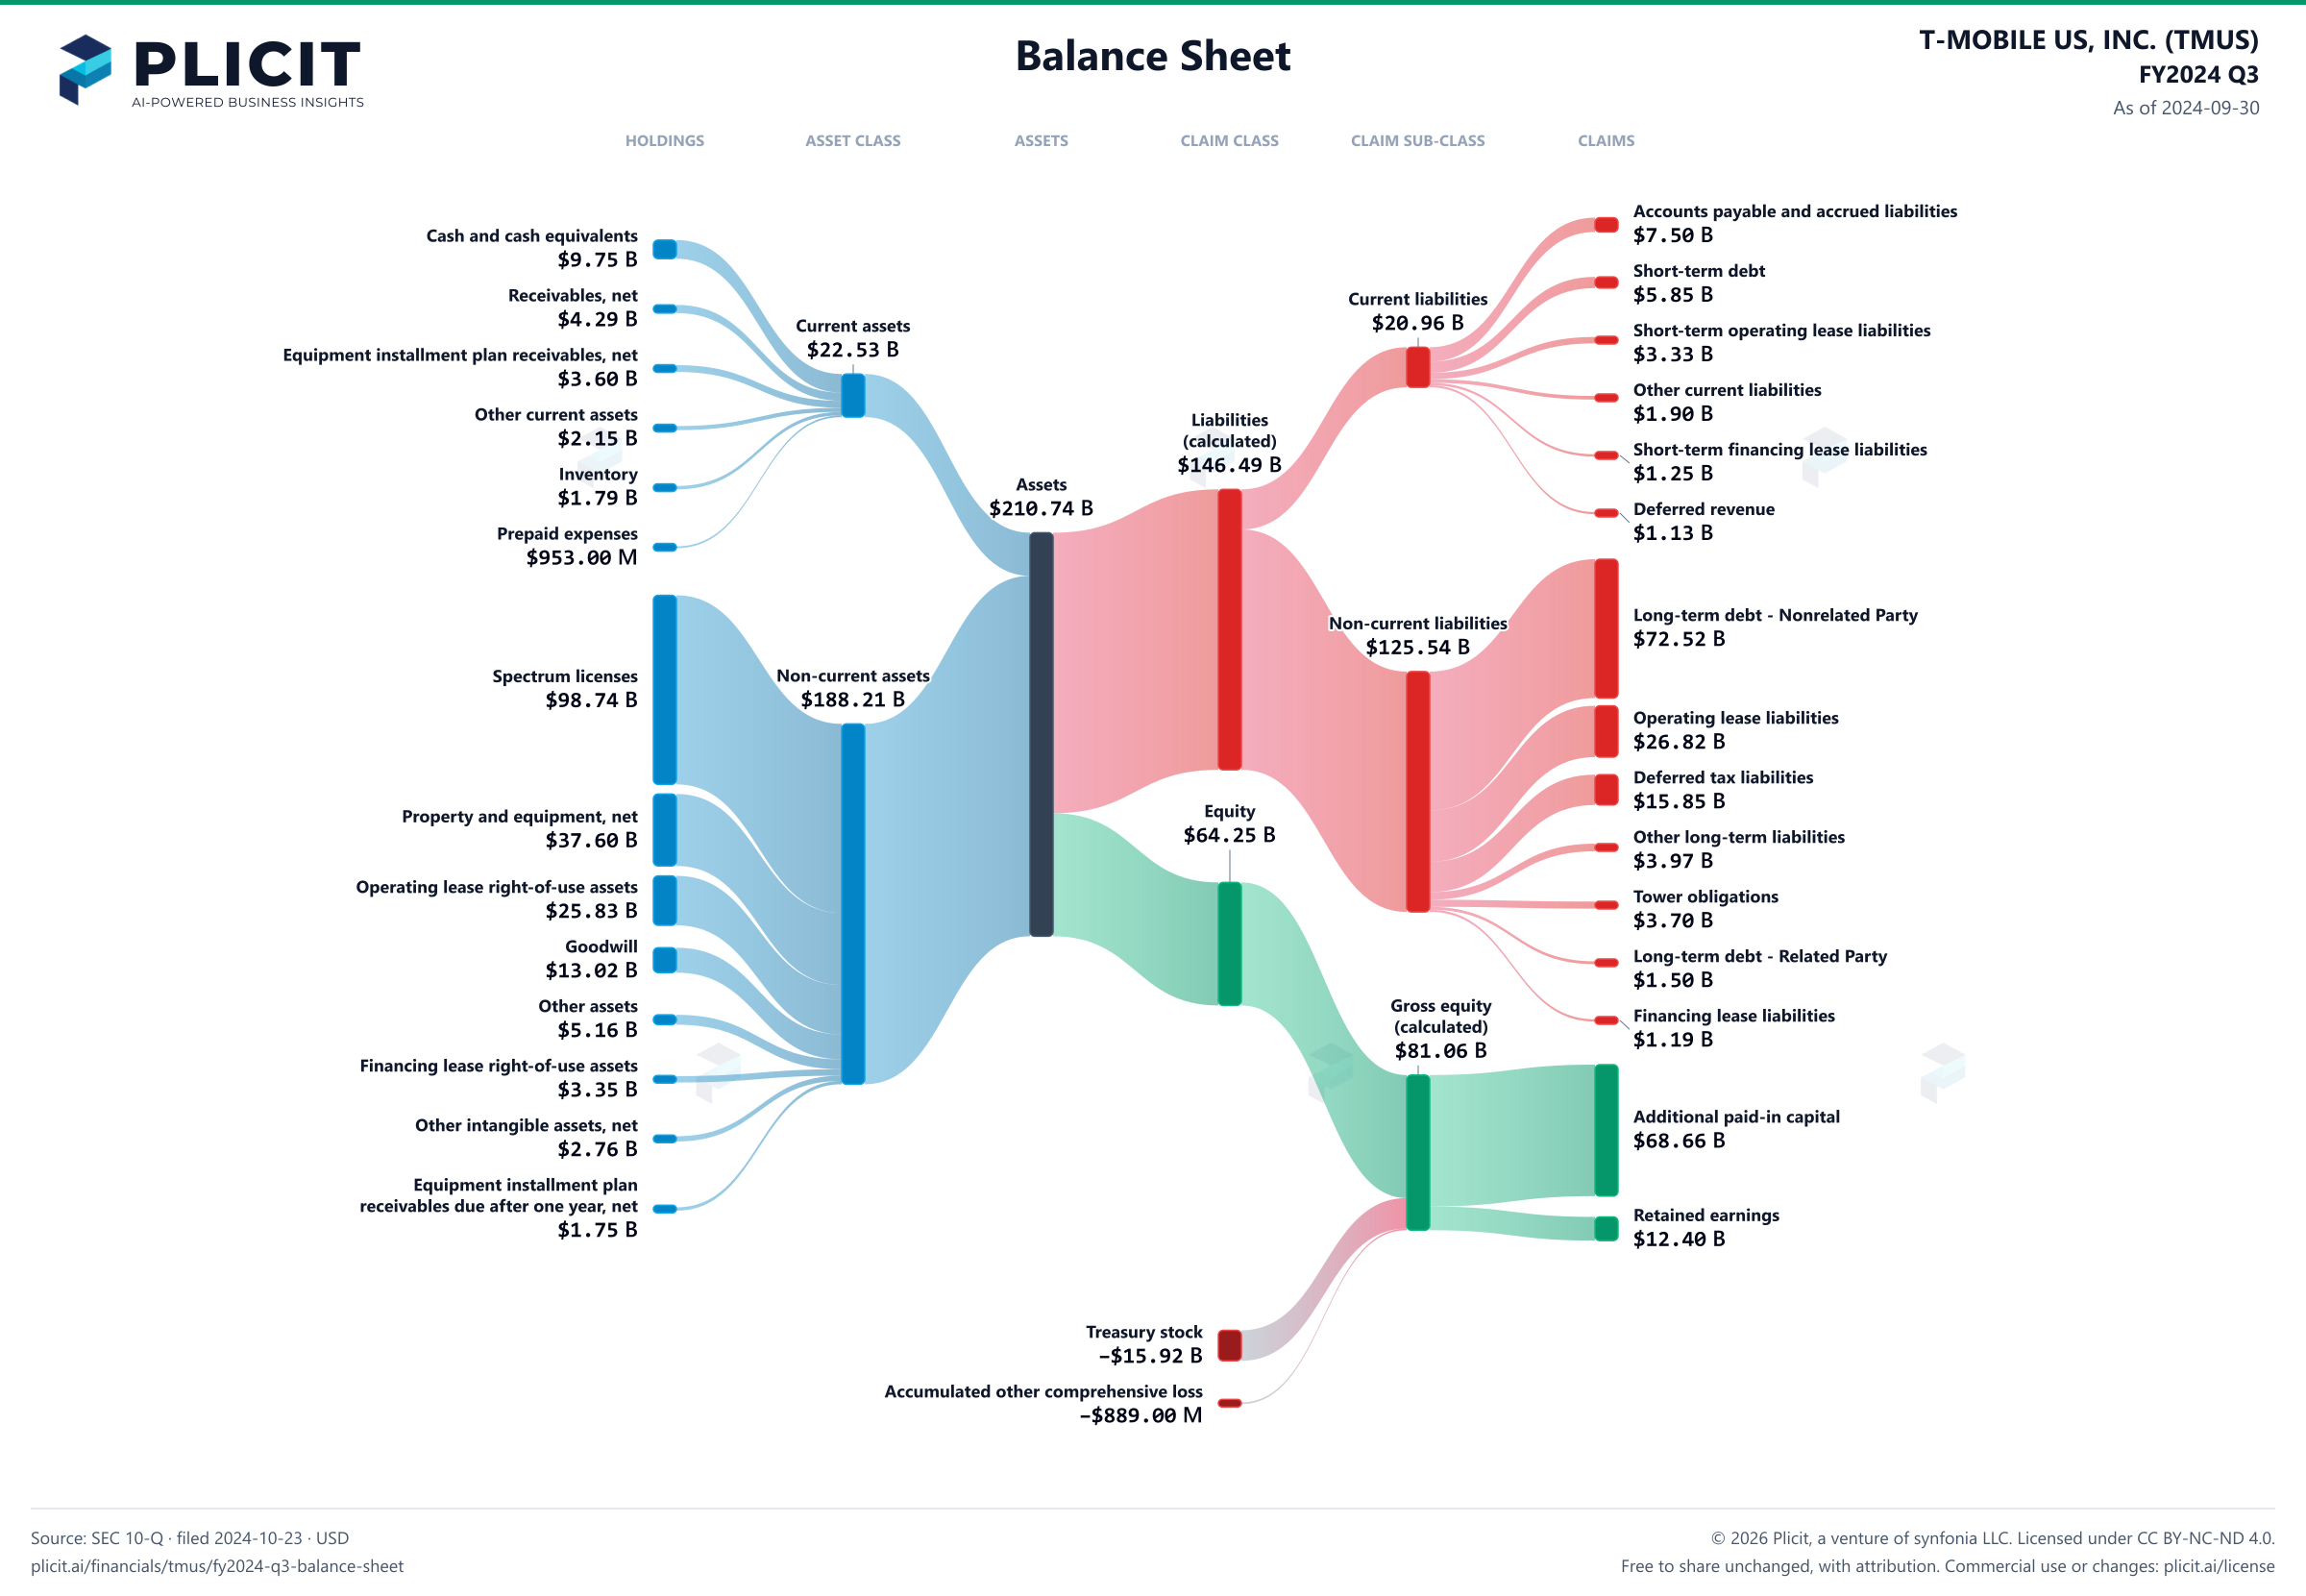
Balance sheet as of 2024-09-30. The chart shows assets, liabilities and equity at that date.
- Assets
- 210,742,000,000 US dollars
- Current assets
- 22,531,000,000 US dollars
- Non-current assets
- 188,211,000,000 US dollars
- Liabilities (calculated)
- 146,492,000,000 US dollars
- Current liabilities
- 20,955,000,000 US dollars
- Non-current liabilities
- 125,537,000,000 US dollars
- Equity
- 64,250,000,000 US dollars
- Cash and cash equivalents
- 9,754,000,000 US dollars
- Accounts receivable, net of allowance for credit losses of $162 and $161
- 4,286,000,000 US dollars
- Equipment installment plan receivables, net of allowance for credit losses and imputed discount of $575 and $623
- 3,595,000,000 US dollars
- Other current assets
- 2,154,000,000 US dollars
- Inventory
- 1,789,000,000 US dollars
- Prepaid expenses
- 953,000,000 US dollars
- Spectrum licenses
- 98,736,000,000 US dollars
- Property and equipment, net
- 37,603,000,000 US dollars
- Operating lease right-of-use assets
- 25,833,000,000 US dollars
- Goodwill
- 13,015,000,000 US dollars
- Other assets
- 5,158,000,000 US dollars
- Financing lease right-of-use assets
- 3,352,000,000 US dollars
- Other intangible assets, net
- 2,762,000,000 US dollars
- Equipment installment plan receivables due after one year, net of allowance for credit losses and imputed discount of $130 and $150
- 1,752,000,000 US dollars
- Accounts payable and accrued liabilities
- 7,496,000,000 US dollars
- Short-term debt
- 5,851,000,000 US dollars
- Short-term operating lease liabilities
- 3,328,000,000 US dollars
- Other current liabilities
- 1,903,000,000 US dollars
- Short-term financing lease liabilities
- 1,252,000,000 US dollars
- Deferred revenue
- 1,125,000,000 US dollars
- Long-term debt - Nonrelated Party
- 72,522,000,000 US dollars
- Operating lease liabilities
- 26,821,000,000 US dollars
- Deferred tax liabilities
- 15,849,000,000 US dollars
- Other long-term liabilities
- 3,968,000,000 US dollars
- Tower obligations
- 3,695,000,000 US dollars
- Long-term debt - Related Party
- 1,497,000,000 US dollars
- Financing lease liabilities
- 1,185,000,000 US dollars
- Additional paid-in capital
- 68,659,000,000 US dollars
- Retained earnings
- 12,401,000,000 US dollars
- Common stock, par value $0.00001 per share, 2,000,000,000 shares authorized; 1,270,824,969 and 1,262,904,154 shares issued, 1,164,613,922 and 1,195,807,331 shares outstanding
- 0 US dollars
- Treasury stock, at cost, 106,211,047 and 67,096,823 shares
- negative 15,921,000,000 US dollars
- Accumulated other comprehensive loss
- negative 889,000,000 US dollars
- Gross equity (calculated)
- 81,060,000,000 US dollars. Net equity plus the magnitudes of its negative contributions equals gross positive equity. The negative contributions enter this reconciliation as add-backs; their filed signs stay negative.
Chart connections
- Assets equal liabilities plus consolidated equity. Consolidated equity includes noncontrolling interests when reported.
- Treasury shares and other negative equity contributions reduce equity.
Free to share unchanged, with credit to Plicit.ai · CC BY-NC-ND 4.0Download PNG
Product waitlist
Health Check and Teardown for your own company
A health check uncovers insights of your private books, not a public ticker. Join this list to get notified as soon as we go-live!