
TRINET GROUP, INC. (TNET) FY2026 Q3 Balance Sheet

Published Source: Form 10-Q on SEC EDGAR filed (opens in a new tab)

As of 2026-09-30

Balance Sheet

Swipe to see the full flow
TRINET GROUP, INC. (TNET) FY2026 Q3 Balance SheetBalance sheet as of 2026-09-30. The chart shows assets, liabilities and equity at that date.Current liabilities$2.14 BCurrent assets$2.43 BLiabilities$3.26 BAssets$3.39 BNon-current liabilities$1.12 BEquity$133.00 MNon-current assets$962.00 MHOLDINGSASSET CLASSASSETSCLAIM CLASSCLAIM SUB-CLASSCLAIMSRestricted cash, cash equivalents and investmentsOther payroll assetsPayroll funds receivableCash and cash equivalentsOther current assetsInvestmentsPrepaid expenses, netAccounts receivable, netGoodwillSoftware and other intangible assets, netOther assetsRestricted cash, cash equivalents and investments, noncurrentOperating lease right-of-use assetProperty and equipment, netPayroll tax liabilities and other payroll withholdingsAccrued wagesAccrued health insurance costs, netAccounts payable and other current liabilitiesClient deposits and other client liabilitiesAccrued workers' compensation costs, netOperating lease liabilitiesInsurance premiums and other payablesLong-term debt, noncurrentAccrued workers' compensation costs, noncurrent, netOperating lease liabilities, noncurrentDeferred taxesOther non-current liabilitiesCommon stock and additional paid-in capital,($0.000025 par value per share; 750,000,000 shares authorized; 45,816,897 and 47,377,950 shares issued and outstanding at September 30, 2026 and December 31, 2025, respectively)Accumulated deficitAccumulated other comprehensive lossCurrent assetsNon-current assetsAssetsCurrent liabilitiesNon-current liabilitiesLiabilitiesEquityEquityPayroll tax liabilities and other payroll withholdingsPayroll tax liabilities and other payroll withholdings$1.20 BRestricted cash, cash equivalents and investmentsRestricted cash, cash equivalents and investments$1.16 BCurrent liabilitiesCurrent liabilities$2.14 BAccrued wagesAccrued wages$561.00 MCurrent assetsCurrent assets$2.43 BOther payroll assetsOther payroll assets$414.00 MAccrued health insurance costs, netAccrued health insurance costs, net$181.00 MAccounts payable and other current liabilitiesAccounts payable and other current liabilities$91.00 MPayroll funds receivablePayroll funds receivable$371.00 MLiabilitiesLiabilities$3.26 BClient deposits and other client liabilitiesClient deposits and other client liabilities$44.00 MCash and cash equivalentsCash and cash equivalents$328.00 MAccrued workers' compensation costs, netAccrued workers' compensation costs, net$42.00 MOther current assetsOther current assets$50.00 MAssetsAssets$3.39 BOperating lease liabilitiesOperating lease liabilities$11.00 MInvestmentsInvestments$50.00 MInsurance premiums and other payablesInsurance premiums and other payables$8.00 MPrepaid expenses, netPrepaid expenses, net$47.00 MLong-term debt, noncurrentLong-term debt, noncurrent$896.00 MAccounts receivable, netAccounts receivable, net$7.00 MNon-current liabilitiesNon-current liabilities$1.12 BAccrued workers' compensation costs, noncurrent, netAccrued workers' compensation costs, noncurrent, net$103.00 MOperating lease liabilities, noncurrentOperating lease liabilities, noncurrent$56.00 MGoodwillGoodwill$465.00 MDeferred taxesDeferred taxes$51.00 MSoftware and other intangible assets, netSoftware and other intangible assets, net$176.00 MEquityEquity$133.00 MNon-current assetsNon-current assets$962.00 MOther non-current liabilitiesOther non-current liabilities$18.00 MOther assetsOther assets$131.00 MRestricted cash, cash equivalents and investments, noncurrentRestricted cash, cash equivalentsand investments, noncurrent$116.00 MCommon stock and additional paid-in capital,($0.000025 par value per share; 750,000,000 shares authorized; 45,816,897 and 47,377,950 shares issued and outstanding at September 30, 2026 and December 31, 2025, respectively)Paid-in capital$1.19 BOperating lease right-of-use assetOperating lease right-of-use asset$47.00 MAccumulated deficitAccumulated deficit−$1.05 BProperty and equipment, netProperty and equipment, net$27.00 MAccumulated other comprehensive lossOther comprehensive loss−$6.00 M
Chart details

TRINET GROUP, INC. (TNET) FY2026 Q3 Balance Sheet

Balance sheet as of 2026-09-30. The chart shows assets, liabilities and equity at that date.

Assets
3,393,000,000 US dollars
Current assets
2,431,000,000 US dollars
Non-current assets
962,000,000 US dollars
Liabilities
3,260,000,000 US dollars
Current liabilities
2,136,000,000 US dollars
Non-current liabilities
1,124,000,000 US dollars
Equity
133,000,000 US dollars
Restricted cash, cash equivalents and investments
1,164,000,000 US dollars
Other payroll assets
414,000,000 US dollars
Payroll funds receivable
371,000,000 US dollars
Cash and cash equivalents
328,000,000 US dollars
Other current assets
50,000,000 US dollars
Investments
50,000,000 US dollars
Prepaid expenses, net
47,000,000 US dollars
Accounts receivable, net
7,000,000 US dollars
Goodwill
465,000,000 US dollars
Software and other intangible assets, net
176,000,000 US dollars
Other assets
131,000,000 US dollars
Restricted cash, cash equivalents and investments, noncurrent
116,000,000 US dollars
Operating lease right-of-use asset
47,000,000 US dollars
Property and equipment, net
27,000,000 US dollars
Payroll tax liabilities and other payroll withholdings
1,198,000,000 US dollars
Accrued wages
561,000,000 US dollars
Accrued health insurance costs, net
181,000,000 US dollars
Accounts payable and other current liabilities
91,000,000 US dollars
Client deposits and other client liabilities
44,000,000 US dollars
Accrued workers' compensation costs, net
42,000,000 US dollars
Operating lease liabilities
11,000,000 US dollars
Insurance premiums and other payables
8,000,000 US dollars
Long-term debt, noncurrent
896,000,000 US dollars
Accrued workers' compensation costs, noncurrent, net
103,000,000 US dollars
Operating lease liabilities, noncurrent
56,000,000 US dollars
Deferred taxes
51,000,000 US dollars
Other non-current liabilities
18,000,000 US dollars
Common stock and additional paid-in capital,($0.000025 par value per share; 750,000,000 shares authorized; 45,816,897 and 47,377,950 shares issued and outstanding at September 30, 2026 and December 31, 2025, respectively)
1,191,000,000 US dollars
Preferred Stock,($0.000025 par value per share; 20,000,000 shares authorized; no shares issued or outstanding at September 30, 2026 and December 31, 2025)
0 US dollars
Accumulated deficit
negative 1,052,000,000 US dollars
Accumulated other comprehensive loss
negative 6,000,000 US dollars

Chart connections

  • Assets equal liabilities plus consolidated equity. Consolidated equity includes noncontrolling interests when reported.
  • Treasury shares and other negative equity contributions reduce equity.
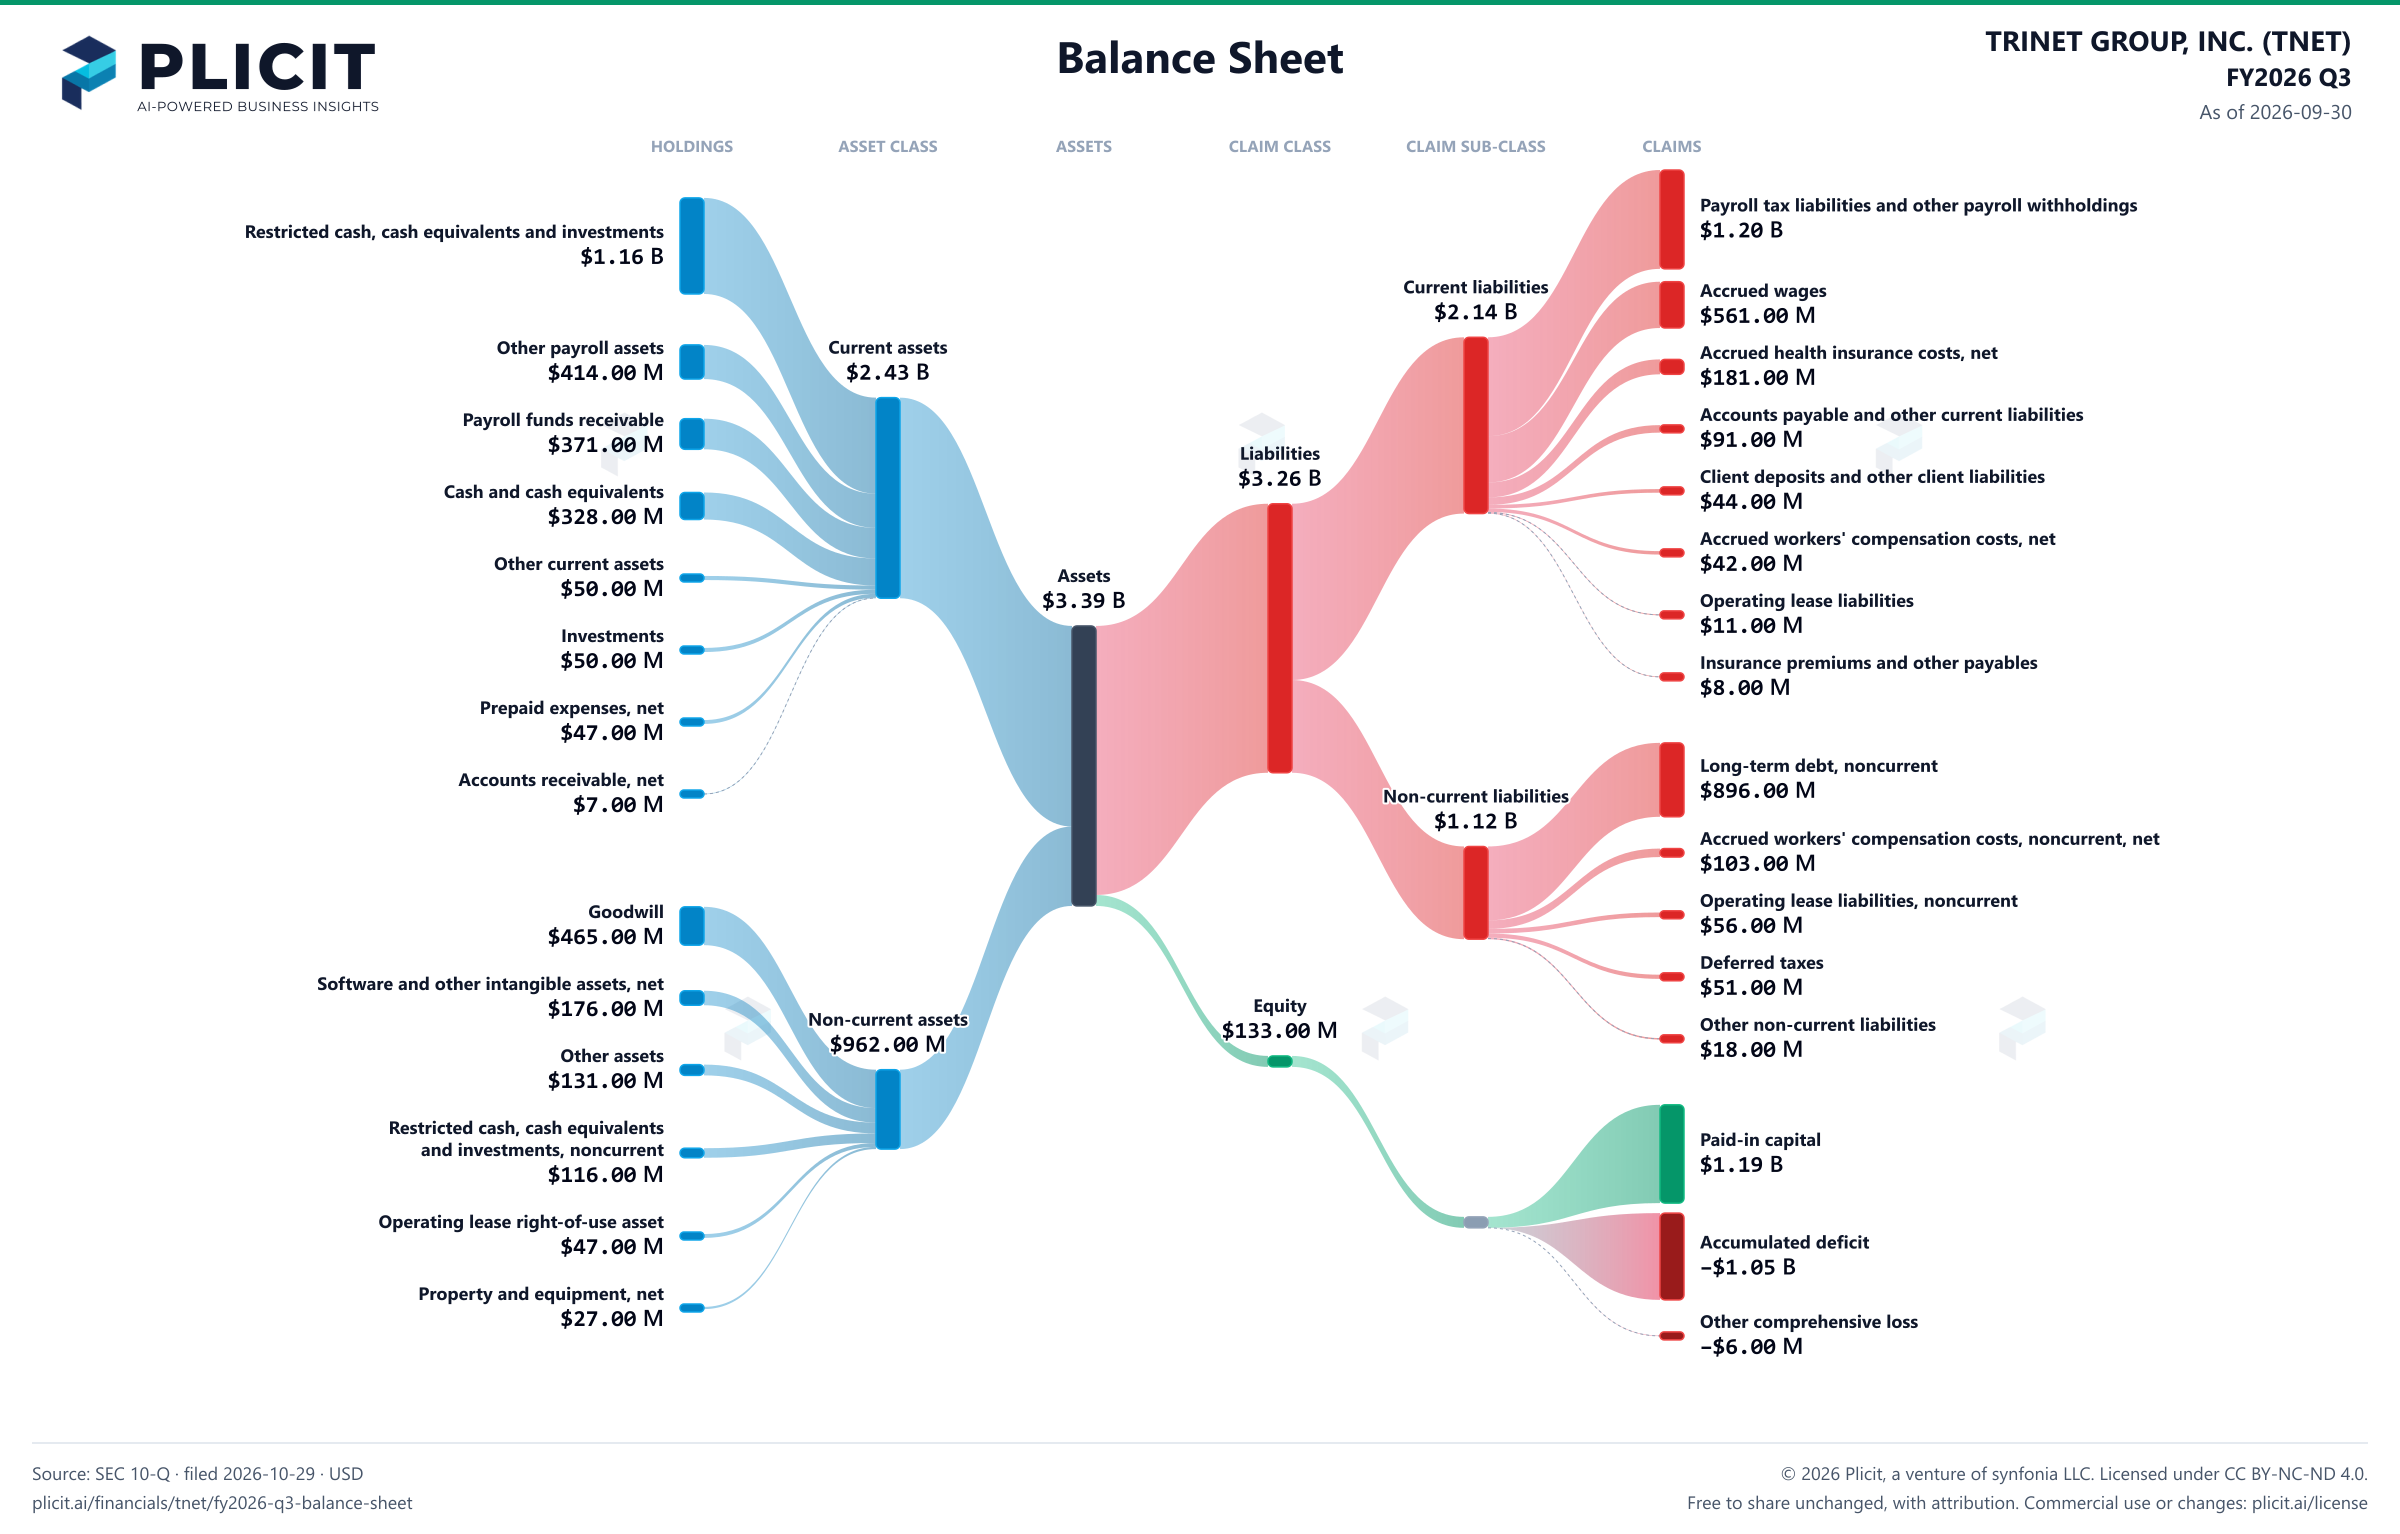
TRINET GROUP, INC. (TNET) FY2026 Q3 Balance Sheet Sankey chart
Free to share unchanged, with credit to Plicit.ai · CC BY-NC-ND 4.0Download PNG

Product waitlist

Health Check and Teardown for your own company

A health check uncovers insights of your private books, not a public ticker. Join this list to get notified as soon as we go-live!