
TRINET GROUP, INC. (TNET) FY2026 Q3 P&L / Income Statement
Published Source: Form 10-Q on SEC EDGAR filed (opens in a new tab)
Revenue by Product and Service
Swipe to see the full flow
Chart details
TRINET GROUP, INC. (TNET) FY2026 Q3 P&L / Income Statement
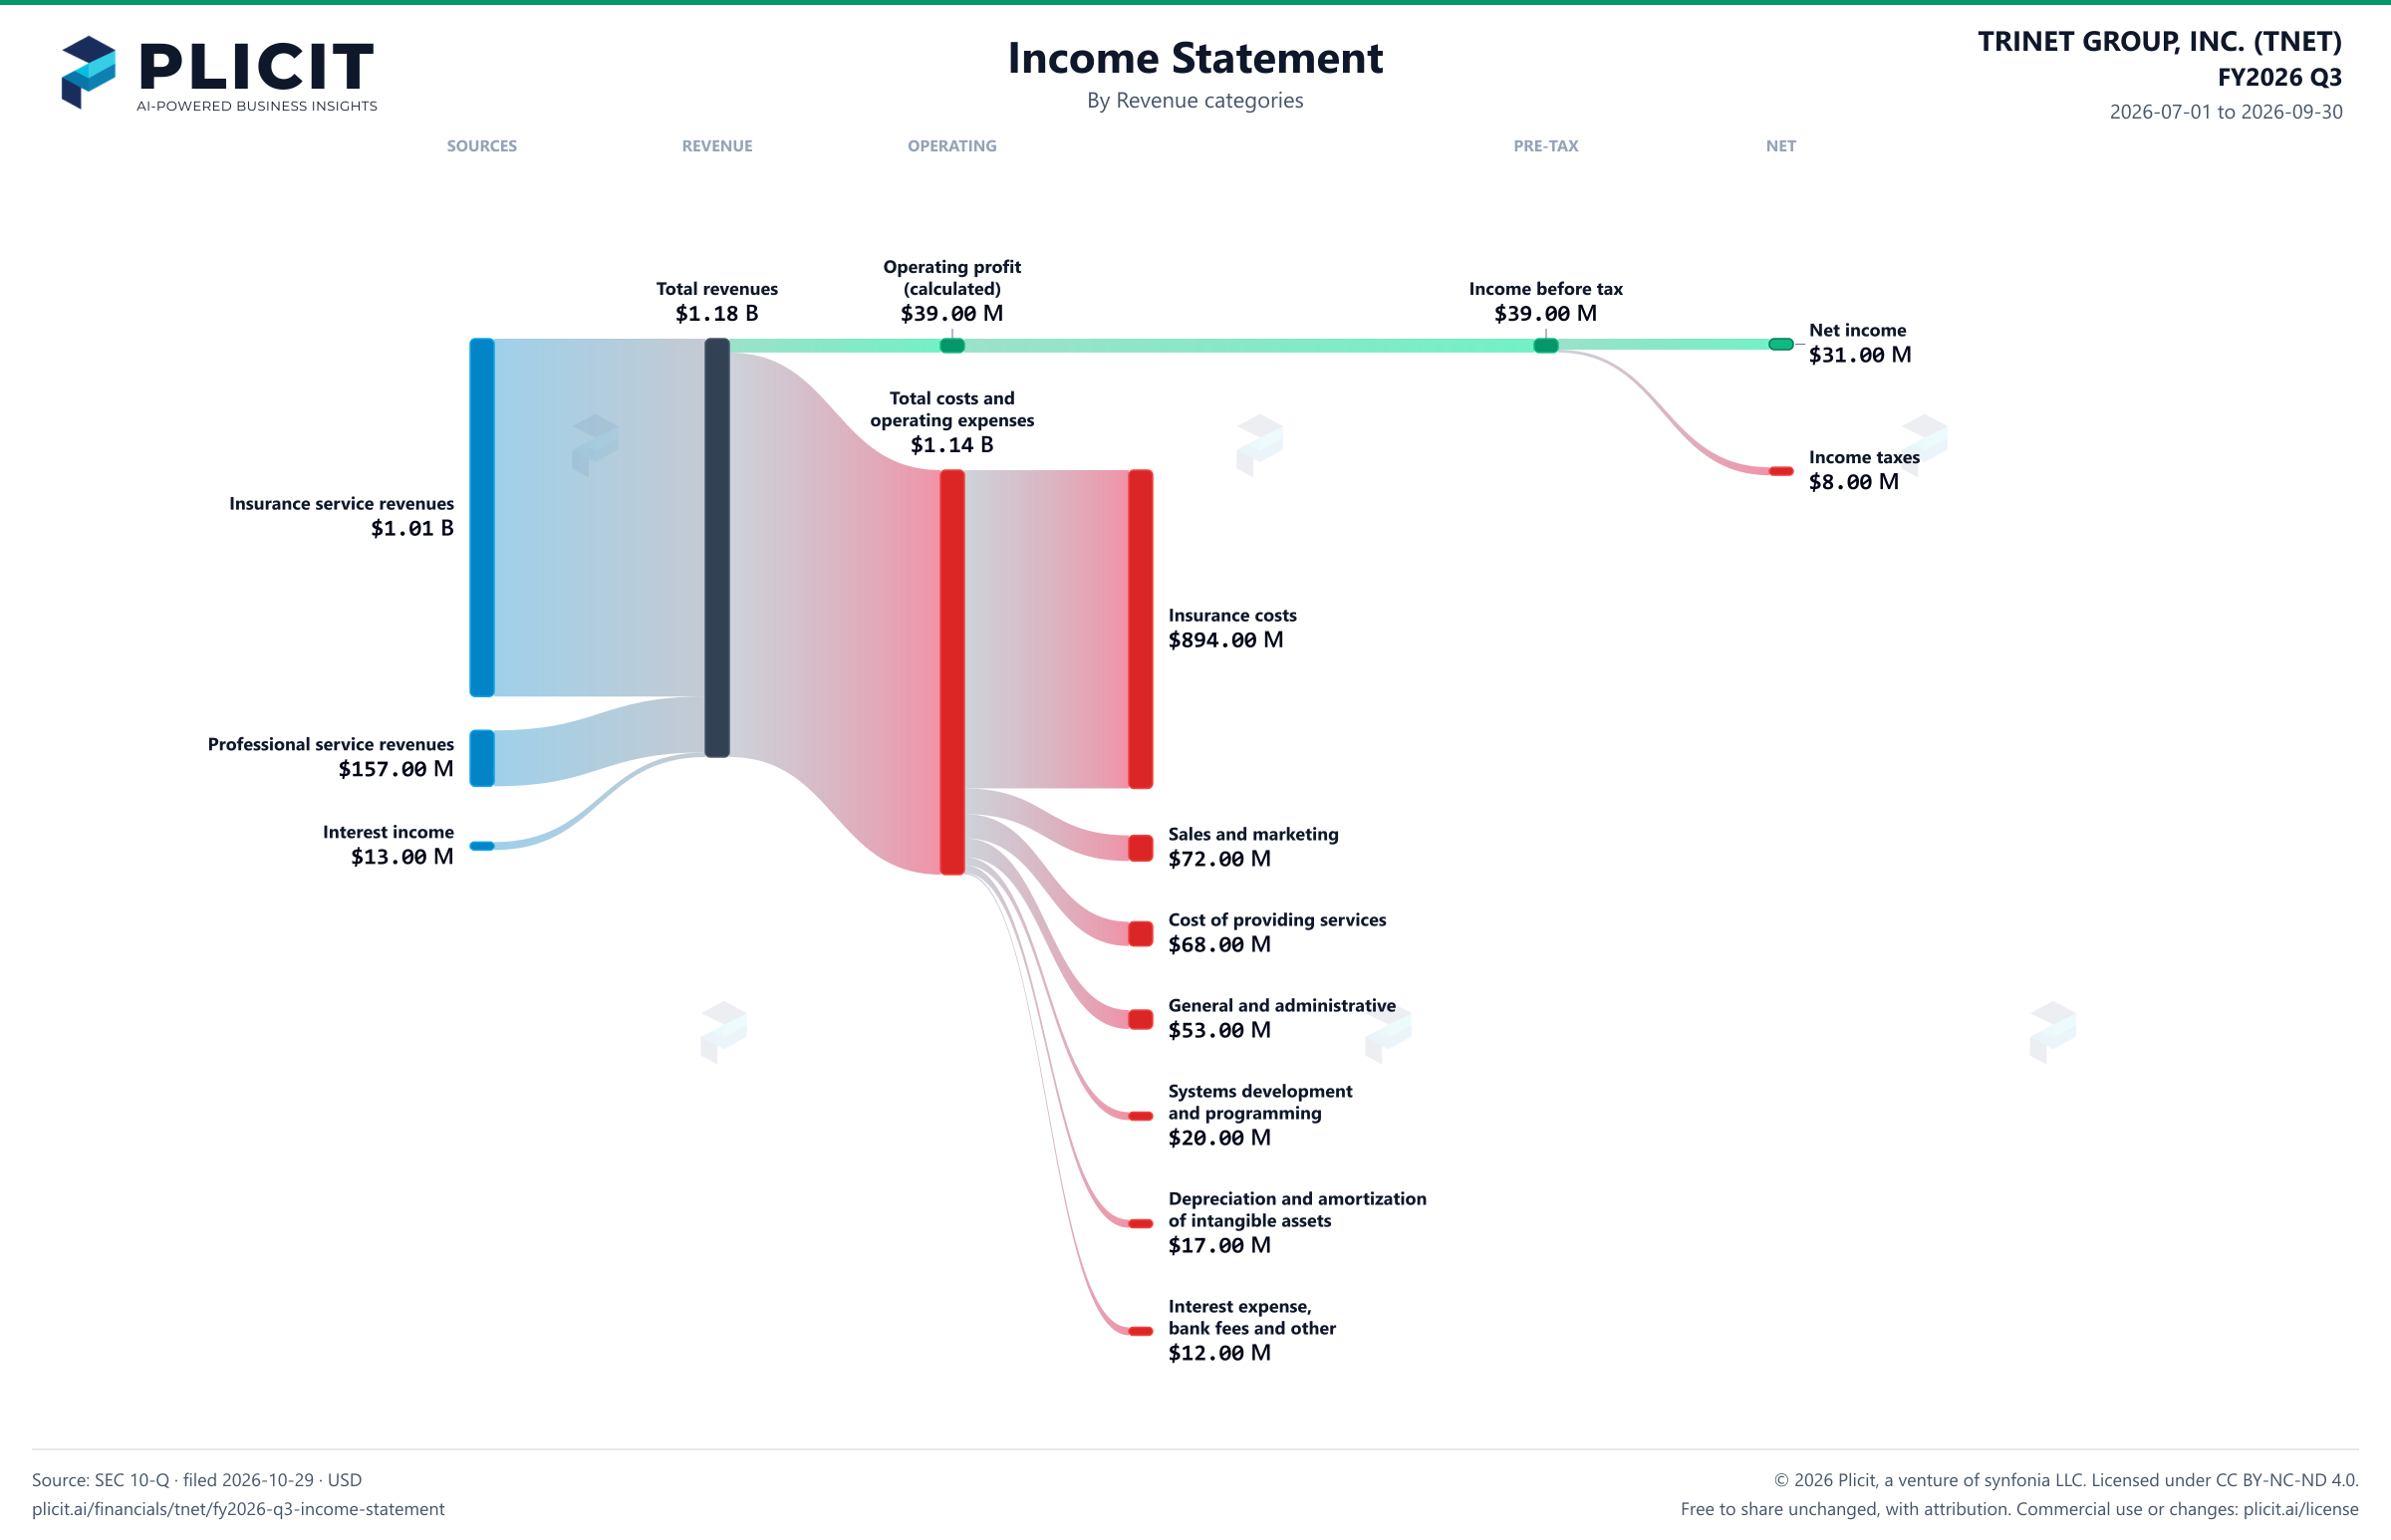
Income statement for 2026-07-01 through 2026-09-30. View: Revenue categories. Revenue uses this breakdown; costs and expenses retain the consolidated categories.
- Total revenues
- 1,175,000,000 US dollars
- Total costs and operating expenses
- 1,136,000,000 US dollars
- Operating profit (calculated)
- 39,000,000 US dollars
- Other income (expense), net (calculated)
- 0 US dollars
- Income before tax
- 39,000,000 US dollars
- Income taxes
- 8,000,000 US dollars
- Net income
- 31,000,000 US dollars
- Insurance service revenues
- 1,005,000,000 US dollars
- Professional service revenues
- 157,000,000 US dollars
- Interest income
- 13,000,000 US dollars
- Cost of providing services
- 68,000,000 US dollars
- Systems development and programming
- 20,000,000 US dollars
- Sales and marketing
- 72,000,000 US dollars
- General and administrative
- 53,000,000 US dollars
- Insurance costs
- 894,000,000 US dollars
- Interest expense, bank fees and other
- 12,000,000 US dollars
- Depreciation and amortization of intangible assets
- 17,000,000 US dollars
Chart connections
- Revenue minus operating expenses equals operating income.
- Operating income plus other income or expense equals income before tax. Income before tax less income tax expense or benefit equals net income.
Free to share unchanged, with credit to Plicit.ai · CC BY-NC-ND 4.0Download PNG
Product waitlist
Health Check and Teardown for your own company
A health check uncovers insights of your private books, not a public ticker. Join this list to get notified as soon as we go-live!