
Travelers Companies, Inc. (TRV) FY2024 Q3 Balance Sheet
As of 2024-09-30
Balance Sheet
As of 2024-09-30
Swipe to see the full flow
Chart details
Travelers Companies, Inc. (TRV) FY2024 Q3 Balance Sheet
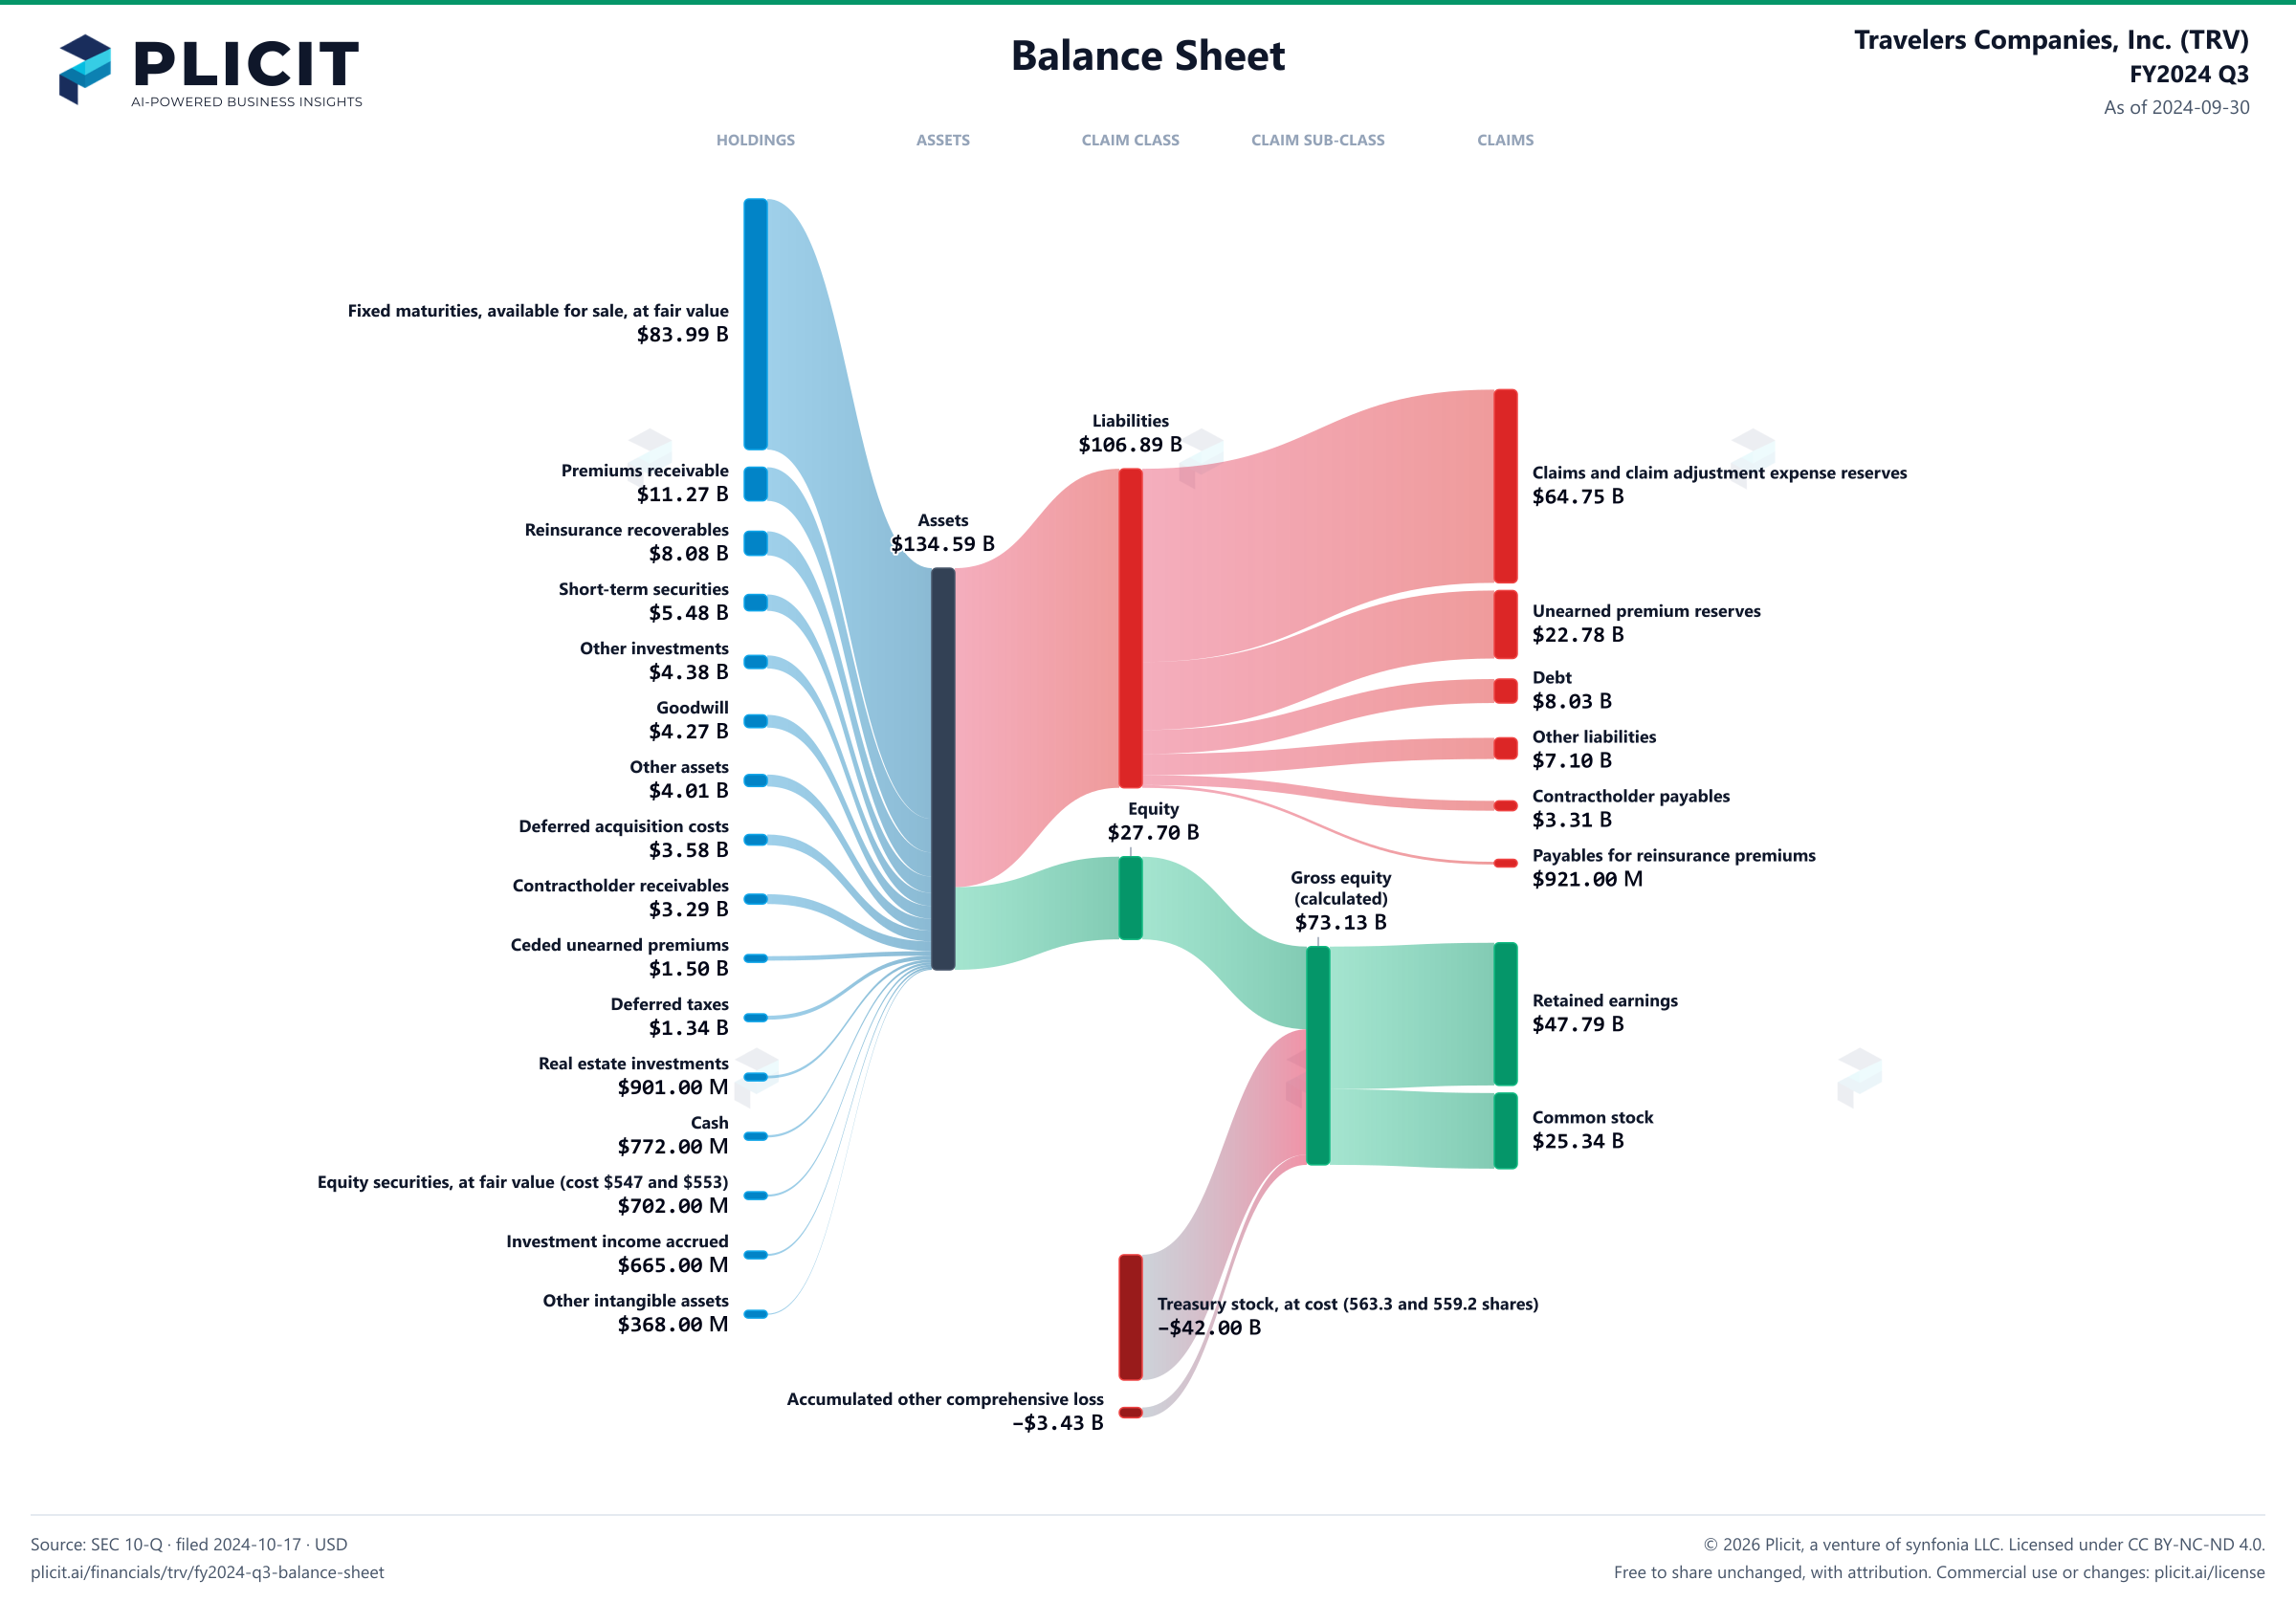
Balance sheet as of 2024-09-30. The chart shows assets, liabilities and equity at that date.
- Assets
- 134,588,000,000 US dollars
- Liabilities
- 106,892,000,000 US dollars
- Equity
- 27,696,000,000 US dollars
- Fixed maturities, available for sale, at fair value (amortized cost $86,657 and $81,781; allowance for expected credit losses of $0 and $5)
- 83,985,000,000 US dollars
- Premiums receivable (net of allowance for expected credit losses of $70 and $69)
- 11,271,000,000 US dollars
- Reinsurance recoverables (net of allowance for estimated uncollectible reinsurance of $120 and $118)
- 8,075,000,000 US dollars
- Short-term securities
- 5,482,000,000 US dollars
- Other investments
- 4,380,000,000 US dollars
- Goodwill
- 4,273,000,000 US dollars
- Other assets
- 4,005,000,000 US dollars
- Deferred acquisition costs
- 3,579,000,000 US dollars
- Contractholder receivables (net of allowance for expected credit losses of $18 and $20)
- 3,292,000,000 US dollars
- Ceded unearned premiums
- 1,502,000,000 US dollars
- Deferred taxes
- 1,336,000,000 US dollars
- Real estate investments
- 901,000,000 US dollars
- Cash
- 772,000,000 US dollars
- Equity securities, at fair value (cost $547 and $553)
- 702,000,000 US dollars
- Investment income accrued
- 665,000,000 US dollars
- Other intangible assets
- 368,000,000 US dollars
- Claims and claim adjustment expense reserves
- 64,746,000,000 US dollars
- Unearned premium reserves
- 22,783,000,000 US dollars
- Debt
- 8,033,000,000 US dollars
- Other liabilities
- 7,099,000,000 US dollars
- Contractholder payables
- 3,310,000,000 US dollars
- Payables for reinsurance premiums
- 921,000,000 US dollars
- Retained earnings
- 47,789,000,000 US dollars
- Common stock (1,750.0 shares authorized; 227.0 and 228.2 shares issued and outstanding)
- 25,339,000,000 US dollars
- Treasury stock, at cost (563.3 and 559.2 shares)
- negative 41,999,000,000 US dollars
- Accumulated other comprehensive loss
- negative 3,433,000,000 US dollars
- Gross equity (calculated)
- 73,128,000,000 US dollars. Net equity plus the magnitudes of its negative contributions equals gross positive equity. The negative contributions enter this reconciliation as add-backs; their filed signs stay negative.
Chart connections
- Assets equal liabilities plus consolidated equity. Consolidated equity includes noncontrolling interests when reported.
- Treasury shares and other negative equity contributions reduce equity.
Free to share unchanged, with credit to Plicit.ai · CC BY-NC-ND 4.0Download PNG
Product waitlist
Health Check and Teardown for your own company
A health check uncovers insights of your private books, not a public ticker. Join this list to get notified as soon as we go-live!