
Travelers Companies, Inc. (TRV) FY2025 Annual Balance Sheet

Balance Sheet

As of 2025-12-31

Swipe to see the full flow
Travelers Companies, Inc. (TRV) FY2025 Annual Balance SheetBalance sheet as of 2025-12-31. The chart shows assets, liabilities and equity at that date.Liabilities$110.81 BAssets$143.71 BEquity$32.89 BGross equity(calculated)$80.84 BHOLDINGSASSETSCLAIM CLASSCLAIM SUB-CLASSCLAIMSFixed maturities, available for sale, at fair value (amortized cost $91,717 and $88,277; allowance for expected credit losses of $3 and $2)Premiums receivable (net of allowance for expected credit losses of $58 and $58)Reinsurance recoverables (net of allowance for estimated uncollectible reinsurance of $129 and $119)Short-term securitiesAssets held for saleOther assetsOther investmentsGoodwillDeferred acquisition costsContractholder receivables (net of allowance for expected credit losses of $16 and $18)Ceded unearned premiumsReal estate investmentsDeferred taxesInvestment income accruedCash (including restricted cash of $132 and $131)Equity securities, at fair value (cost $457 and $544)Other intangible assetsClaims and claim adjustment expense reservesUnearned premium reservesDebtOther liabilitiesContractholder payablesLiabilities held for salePayables for reinsurance premiumsRetained earningsCommon stock (1,750.0 shares authorized; 217.5 and 226.6 shares issued and outstanding)AssetsLiabilitiesEquityGross equity (calculated)Treasury stock, at cost (575.9 and 564.3 shares)Accumulated other comprehensive lossFixed maturities, available for sale, at fair value (amortized cost $91,717 and $88,277; allowance for expected credit losses of $3 and $2)Fixed maturities, available for sale, at fair value$89.83 BLiabilitiesLiabilities$110.81 BPremiums receivable (net of allowance for expected credit losses of $58 and $58)Premiums receivable$10.99 BClaims and claim adjustment expense reservesClaims and claim adjustment expense reserves$65.74 BReinsurance recoverables (net of allowance for estimated uncollectible reinsurance of $129 and $119)Reinsurance recoverables$7.89 BAssetsAssets$143.71 BShort-term securitiesShort-term securities$5.72 BUnearned premium reservesUnearned premium reserves$22.43 BAssets held for saleAssets held for sale$4.55 BDebtDebt$9.27 BOther assetsOther assets$4.28 BOther liabilitiesOther liabilities$7.28 BOther investmentsOther investments$4.12 BContractholder payablesContractholder payables$3.03 BGoodwillGoodwill$4.07 BEquityEquity$32.89 BLiabilities held for saleLiabilities held for sale$2.54 BDeferred acquisition costsDeferred acquisition costs$3.52 BPayables for reinsurance premiumsPayables for reinsurance premiums$529.00 MGross equity (calculated)Gross equity(calculated)$80.84 BContractholder receivables (net of allowance for expected credit losses of $16 and $18)Contractholder receivables$3.01 BCeded unearned premiumsCeded unearned premiums$1.28 BRetained earningsRetained earnings$54.93 BReal estate investmentsReal estate investments$900.00 MDeferred taxesDeferred taxes$887.00 MCommon stock (1,750.0 shares authorized; 217.5 and 226.6 shares issued and outstanding)Common stock$25.91 BInvestment income accruedInvestment income accrued$877.00 MCash (including restricted cash of $132 and $131)Cash (including restricted cash of $132 and $131)$842.00 MEquity securities, at fair value (cost $457 and $544)Equity securities, at fair value (cost $457 and $544)$618.00 MTreasury stock, at cost (575.9 and 564.3 shares)Treasury stock, at cost (575.9 and 564.3 shares)−$45.45 BOther intangible assetsOther intangible assets$336.00 MAccumulated other comprehensive lossAccumulated other comprehensive loss−$2.50 B
Chart details

Travelers Companies, Inc. (TRV) FY2025 Annual Balance Sheet

Balance sheet as of 2025-12-31. The chart shows assets, liabilities and equity at that date.

Assets
143,708,000,000 US dollars
Liabilities
110,814,000,000 US dollars
Equity
32,894,000,000 US dollars
Fixed maturities, available for sale, at fair value (amortized cost $91,717 and $88,277; allowance for expected credit losses of $3 and $2)
89,833,000,000 US dollars
Premiums receivable (net of allowance for expected credit losses of $58 and $58)
10,992,000,000 US dollars
Reinsurance recoverables (net of allowance for estimated uncollectible reinsurance of $129 and $119)
7,886,000,000 US dollars
Short-term securities
5,716,000,000 US dollars
Assets held for sale
4,550,000,000 US dollars
Other assets
4,279,000,000 US dollars
Other investments
4,115,000,000 US dollars
Goodwill
4,066,000,000 US dollars
Deferred acquisition costs
3,518,000,000 US dollars
Contractholder receivables (net of allowance for expected credit losses of $16 and $18)
3,010,000,000 US dollars
Ceded unearned premiums
1,283,000,000 US dollars
Real estate investments
900,000,000 US dollars
Deferred taxes
887,000,000 US dollars
Investment income accrued
877,000,000 US dollars
Cash (including restricted cash of $132 and $131)
842,000,000 US dollars
Equity securities, at fair value (cost $457 and $544)
618,000,000 US dollars
Other intangible assets
336,000,000 US dollars
Claims and claim adjustment expense reserves
65,737,000,000 US dollars
Unearned premium reserves
22,431,000,000 US dollars
Debt
9,267,000,000 US dollars
Other liabilities
7,282,000,000 US dollars
Contractholder payables
3,026,000,000 US dollars
Liabilities held for sale
2,542,000,000 US dollars
Payables for reinsurance premiums
529,000,000 US dollars
Retained earnings
54,931,000,000 US dollars
Common stock (1,750.0 shares authorized; 217.5 and 226.6 shares issued and outstanding)
25,910,000,000 US dollars
Treasury stock, at cost (575.9 and 564.3 shares)
negative 45,447,000,000 US dollars
Accumulated other comprehensive loss
negative 2,500,000,000 US dollars
Gross equity (calculated)
80,841,000,000 US dollars. Net equity plus the magnitudes of its negative contributions equals gross positive equity. The negative contributions enter this reconciliation as add-backs; their filed signs stay negative.

Chart connections

  • Assets equal liabilities plus consolidated equity. Consolidated equity includes noncontrolling interests when reported.
  • Treasury shares and other negative equity contributions reduce equity.
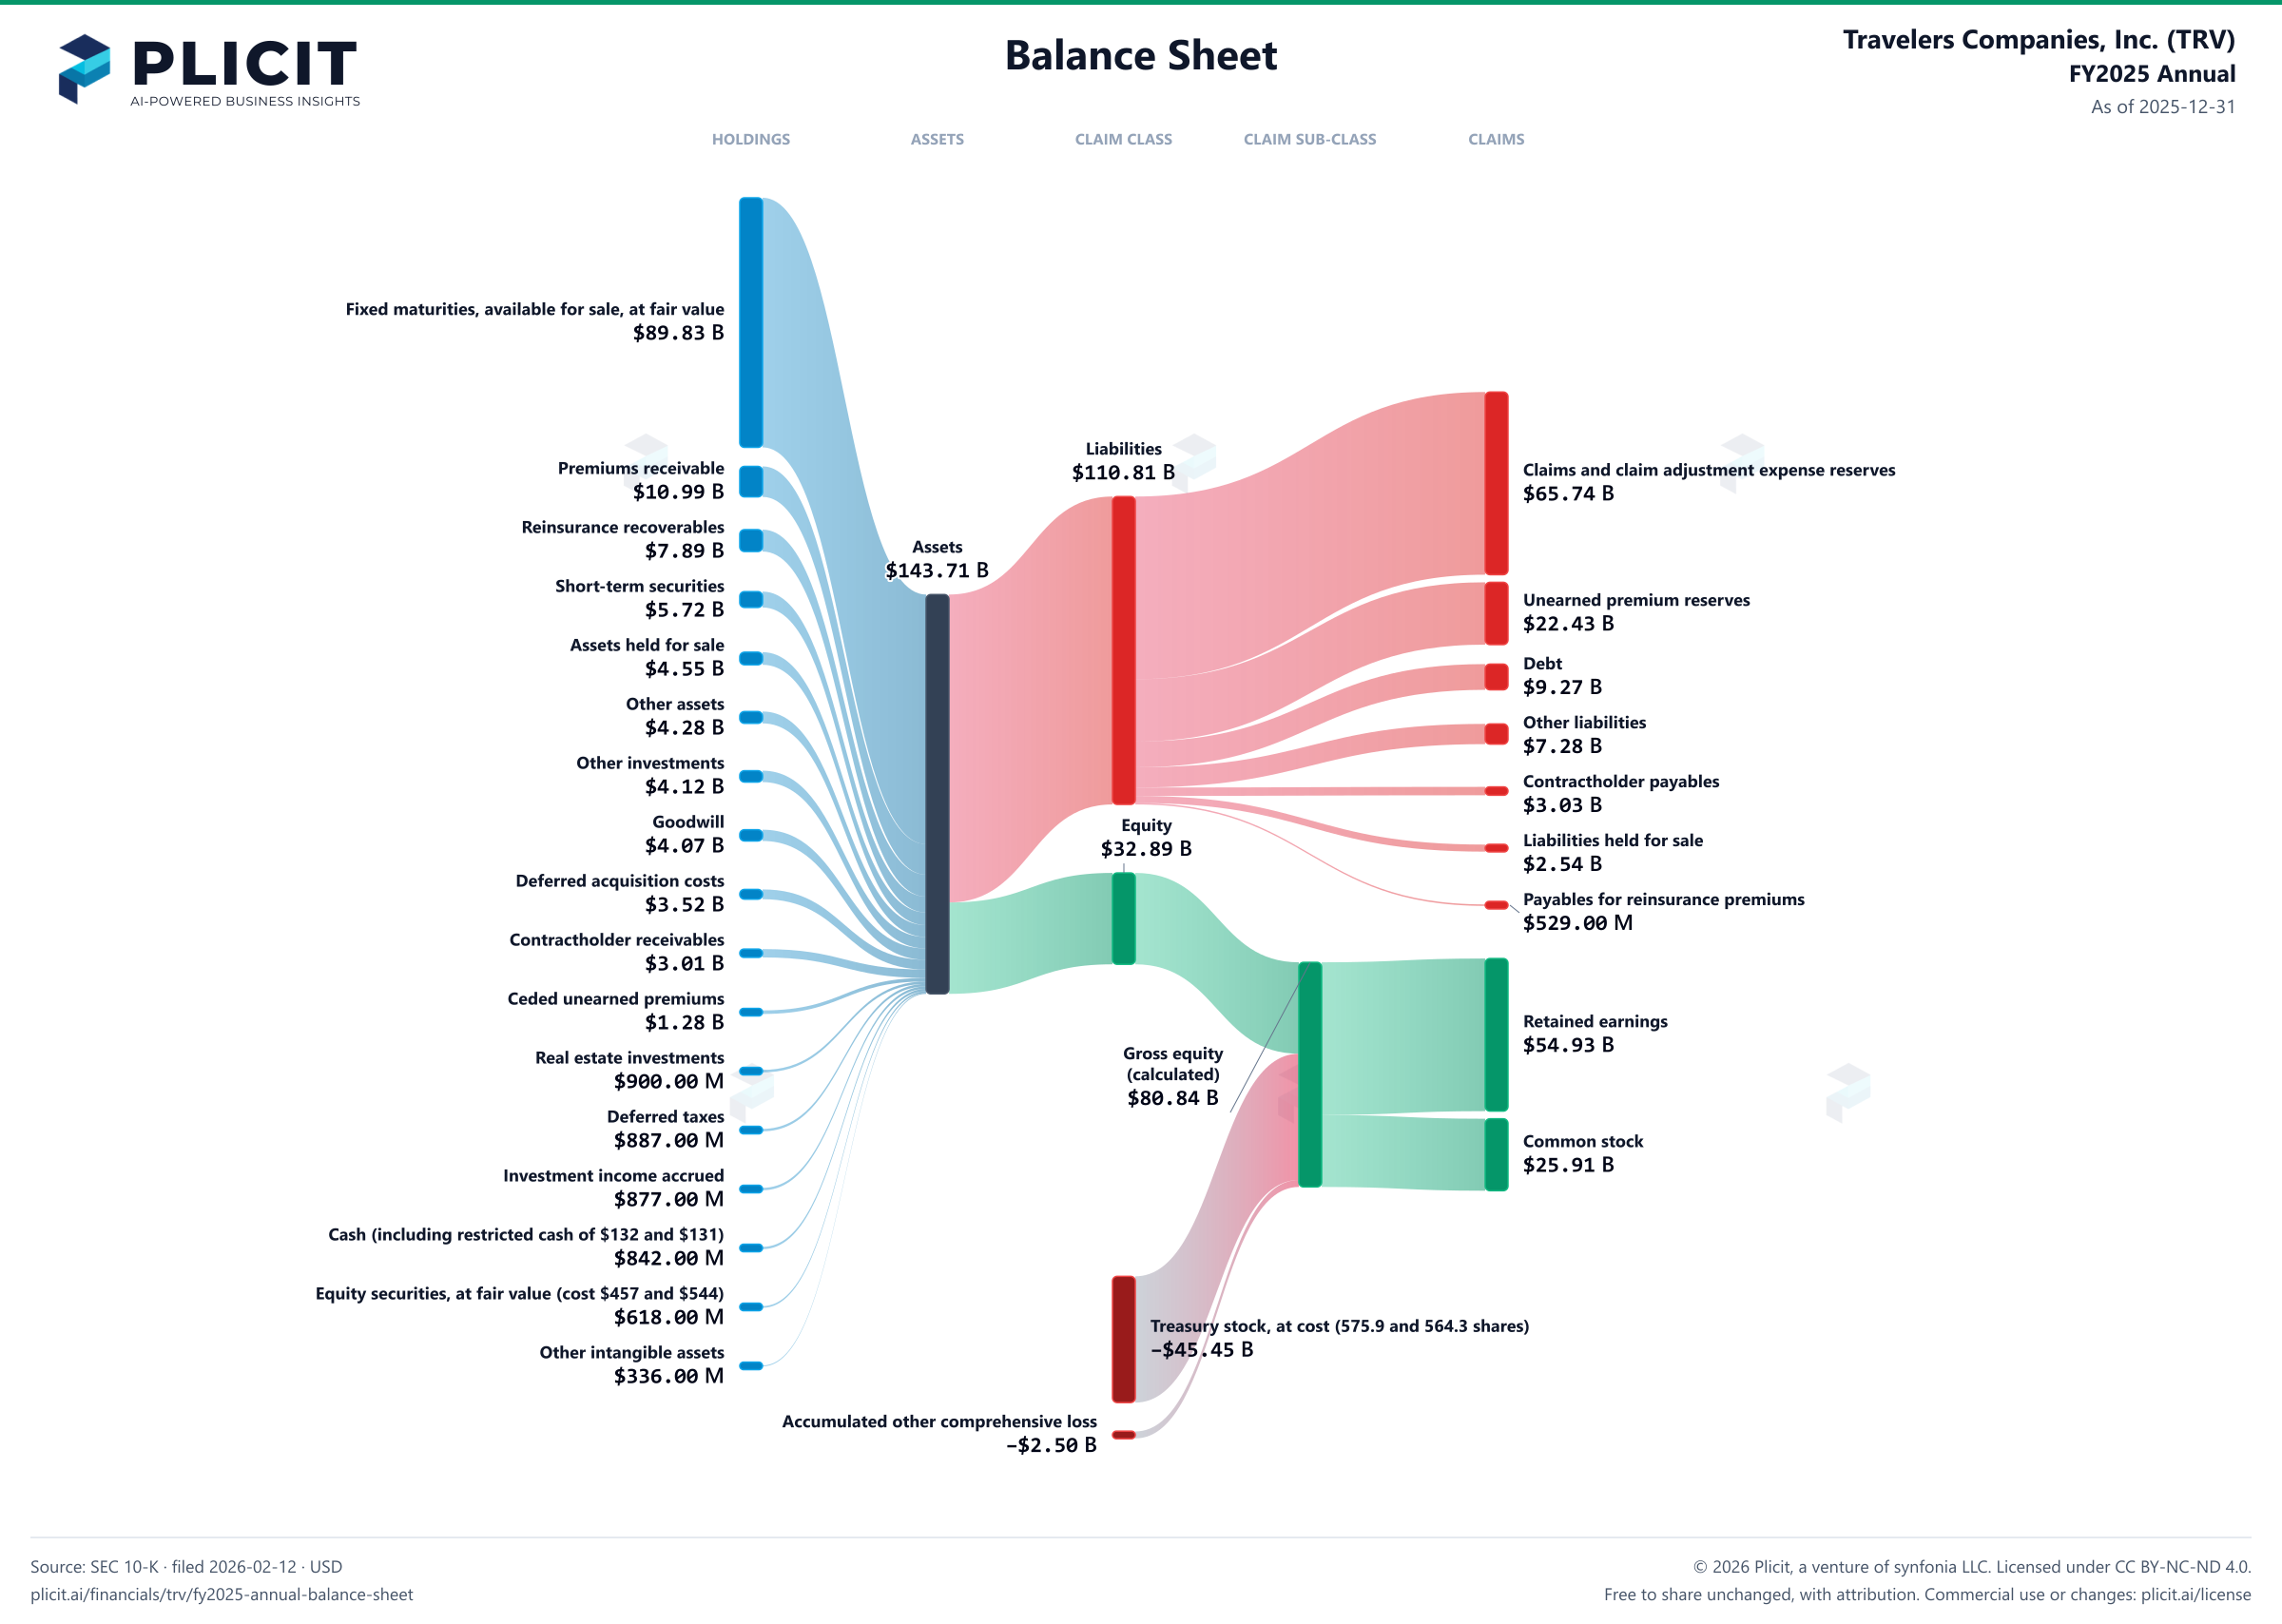
Travelers Companies, Inc. (TRV) FY2025 Annual Balance Sheet Sankey chart
Free to share unchanged, with credit to Plicit.ai · CC BY-NC-ND 4.0Download PNG

Newsletter

Get the teardowns by email

Subscribe if you want the public-company teardowns in your inbox when they're released.

Product waitlist

Health Check and Teardown for your own company

A health check uncovers insights of your private books, not a public ticker. Join this list to get notified as soon as we go-live!