
TAKE-TWO INTERACTIVE SOFTWARE, INC. (TTWO) FY2027 Q1 Balance Sheet
As of 2026-06-30
Balance Sheet
As of 2026-06-30
Swipe to see the full flow
Chart details
TAKE-TWO INTERACTIVE SOFTWARE, INC. (TTWO) FY2027 Q1 Balance Sheet
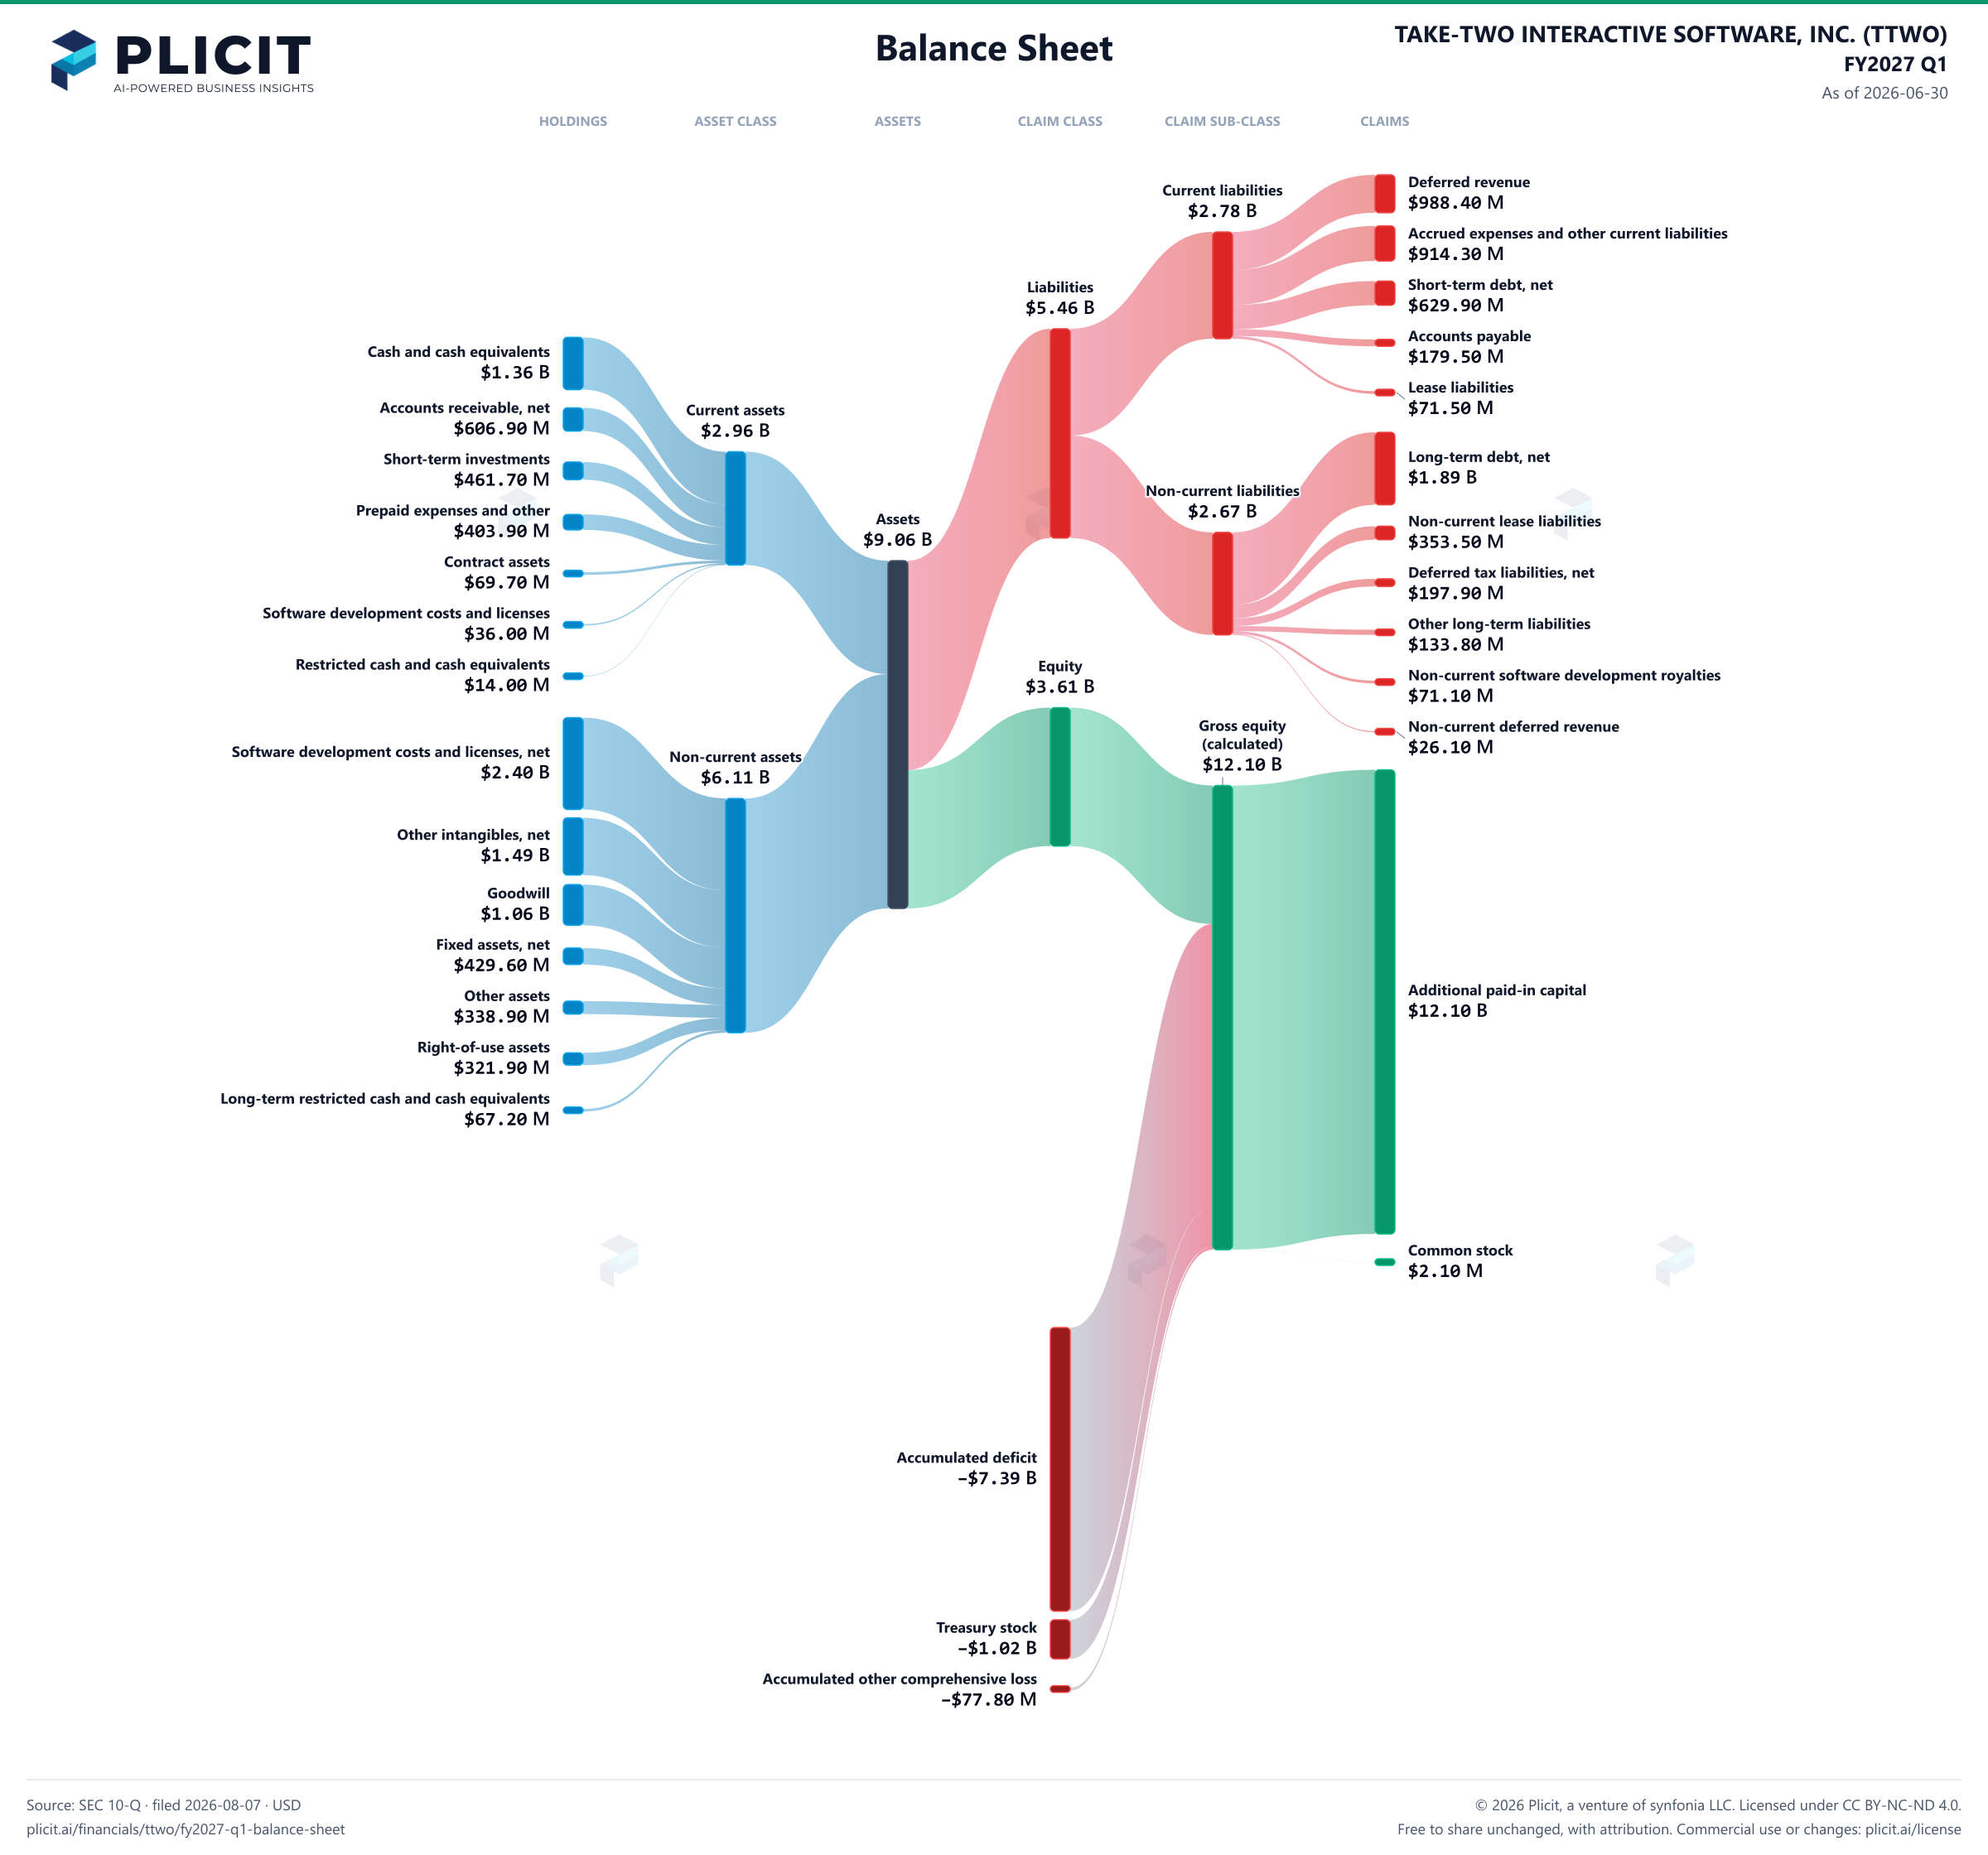
Balance sheet as of 2026-06-30. The chart shows assets, liabilities and equity at that date.
- Assets
- 9,064,200,000 US dollars
- Current assets
- 2,957,100,000 US dollars
- Non-current assets
- 6,107,100,000 US dollars
- Liabilities
- 5,455,800,000 US dollars
- Current liabilities
- 2,783,600,000 US dollars
- Non-current liabilities
- 2,672,200,000 US dollars
- Equity
- 3,608,400,000 US dollars
- Cash and cash equivalents
- 1,364,900,000 US dollars
- Accounts receivable, net of allowances of $0.8 and $0.9 at June 30, 2026 and March 31, 2026, respectively
- 606,900,000 US dollars
- Short-term investments
- 461,700,000 US dollars
- Prepaid expenses and other
- 403,900,000 US dollars
- Contract assets
- 69,700,000 US dollars
- Software development costs and licenses
- 36,000,000 US dollars
- Restricted cash and cash equivalents
- 14,000,000 US dollars
- Software development costs and licenses, net of current portion
- 2,395,000,000 US dollars
- Other intangibles, net
- 1,493,600,000 US dollars
- Goodwill
- 1,060,900,000 US dollars
- Fixed assets, net
- 429,600,000 US dollars
- Other assets
- 338,900,000 US dollars
- Right-of-use assets
- 321,900,000 US dollars
- Long-term restricted cash and cash equivalents
- 67,200,000 US dollars
- Deferred revenue
- 988,400,000 US dollars
- Accrued expenses and other current liabilities
- 914,300,000 US dollars
- Short-term debt, net
- 629,900,000 US dollars
- Accounts payable
- 179,500,000 US dollars
- Lease liabilities
- 71,500,000 US dollars
- Long-term debt, net
- 1,889,800,000 US dollars
- Non-current lease liabilities
- 353,500,000 US dollars
- Deferred tax liabilities, net
- 197,900,000 US dollars
- Other long-term liabilities
- 133,800,000 US dollars
- Non-current software development royalties
- 71,100,000 US dollars
- Non-current deferred revenue
- 26,100,000 US dollars
- Additional paid-in capital
- 12,095,800,000 US dollars
- Common stock, $0.01 par value, 300.0 and 300.0 shares authorized; 210.7 and 209.1 shares issued and 187.0 and 185.4 outstanding at June 30, 2026 and March 31, 2026, respectively
- 2,100,000 US dollars
- Preferred stock, $0.01 par value, 5.0 shares authorized; no shares issued and outstanding at June 30, 2026 and March 31, 2026
- 0 US dollars
- Accumulated deficit
- negative 7,391,100,000 US dollars
- Treasury stock, at cost; 23700000 and 23700000 common shares at June 30, 2026 and March 31, 2026, respectively
- negative 1,020,600,000 US dollars
- Accumulated other comprehensive loss
- negative 77,800,000 US dollars
- Gross equity (calculated)
- 12,097,900,000 US dollars. Net equity plus the magnitudes of its negative contributions equals gross positive equity. The negative contributions enter this reconciliation as add-backs; their filed signs stay negative.
Chart connections
- Assets equal liabilities plus consolidated equity. Consolidated equity includes noncontrolling interests when reported.
- Treasury shares and other negative equity contributions reduce equity.
Free to share unchanged, with credit to Plicit.ai · CC BY-NC-ND 4.0Download PNG
Product waitlist
Health Check and Teardown for your own company
A health check uncovers insights of your private books, not a public ticker. Join this list to get notified as soon as we go-live!