
Tradeweb Markets Inc. (TW) FY2026 Q2 Balance Sheet
As of 2026-06-30
Balance Sheet
As of 2026-06-30
Swipe to see the full flow
Chart details
Tradeweb Markets Inc. (TW) FY2026 Q2 Balance Sheet
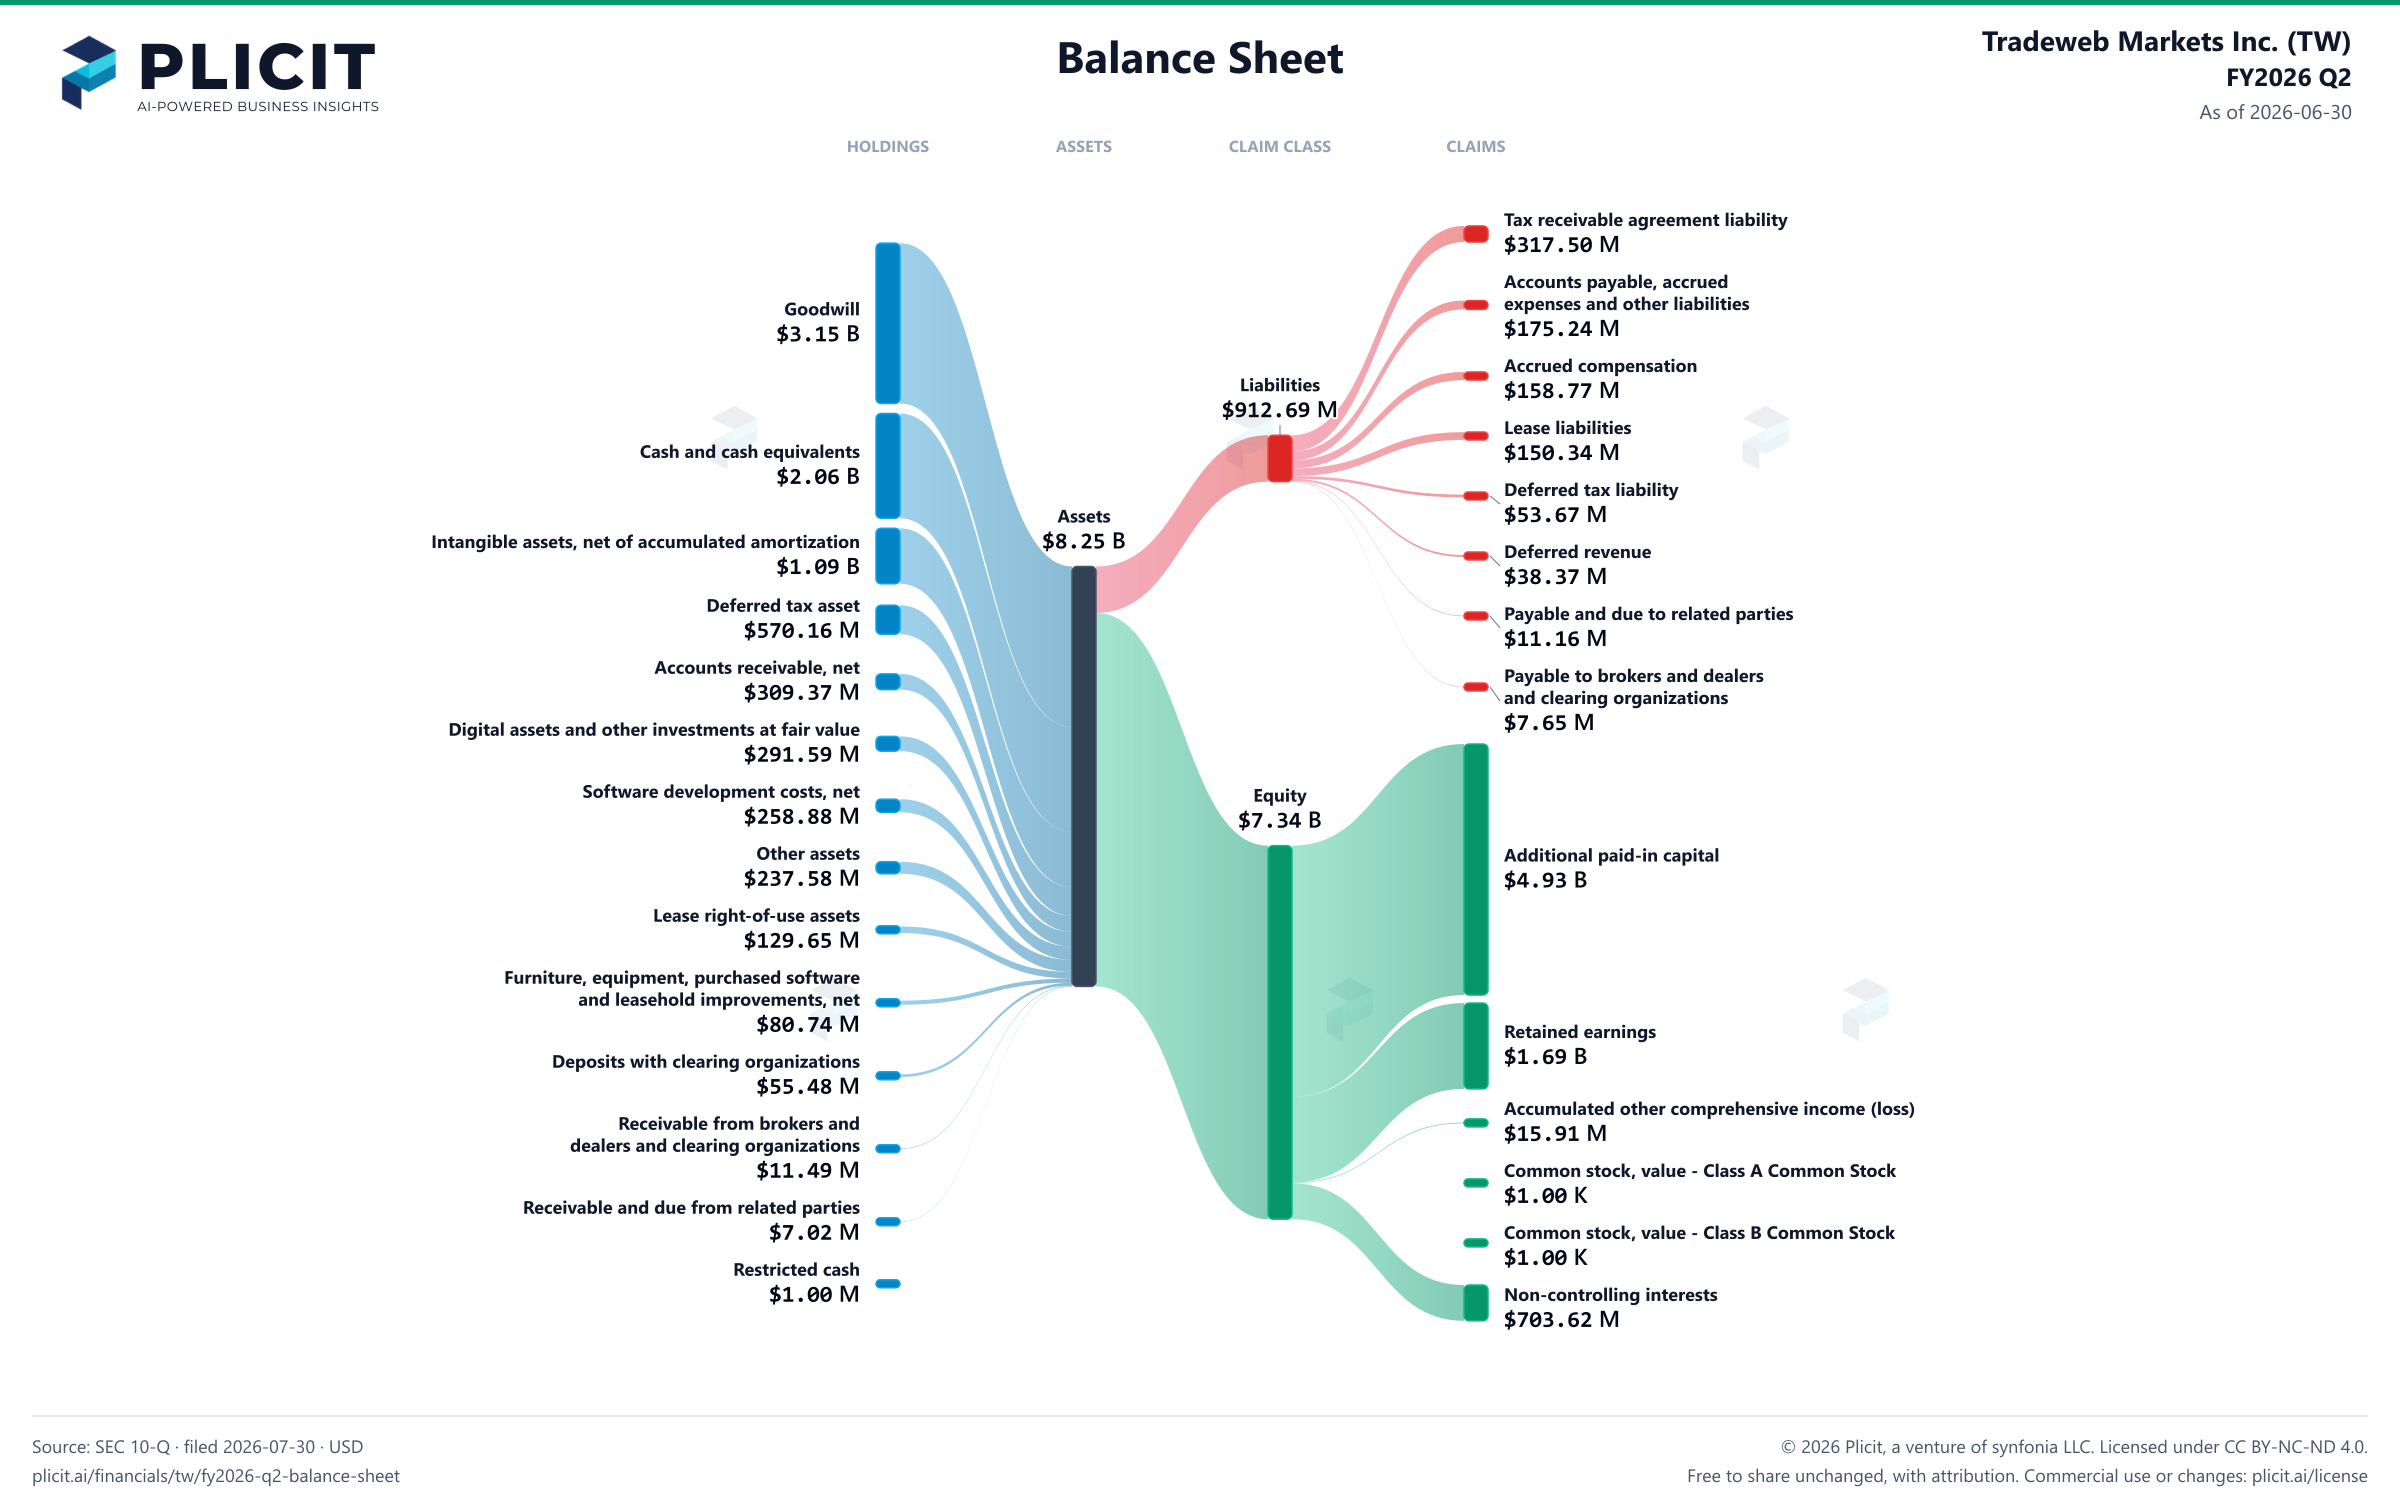
Balance sheet as of 2026-06-30. The chart shows assets, liabilities and equity at that date.
- Assets
- 8,250,843,000 US dollars
- Liabilities
- 912,689,000 US dollars
- Equity
- 7,338,154,000 US dollars
- Noncontrolling interest
- 703,623,000 US dollars. Included in consolidated equity; this amount is not added again.
- Goodwill
- 3,150,112,000 US dollars
- Cash and cash equivalents
- 2,057,929,000 US dollars
- Intangible assets, net of accumulated amortization
- 1,089,848,000 US dollars
- Deferred tax asset
- 570,156,000 US dollars
- Accounts receivable, net of allowance for credit losses of $209 and $587 at June 30, 2026 and December 31, 2025, respectively
- 309,368,000 US dollars
- Digital assets and other investments at fair value
- 291,587,000 US dollars
- Software development costs, net of accumulated amortization
- 258,884,000 US dollars
- Other assets
- 237,582,000 US dollars
- Lease right-of-use assets
- 129,651,000 US dollars
- Furniture, equipment, purchased software and leasehold improvements, net of accumulated depreciation and amortization
- 80,742,000 US dollars
- Deposits with clearing organizations
- 55,477,000 US dollars
- Receivable from brokers and dealers and clearing organizations
- 11,491,000 US dollars
- Receivable and due from related parties
- 7,016,000 US dollars
- Restricted cash
- 1,000,000 US dollars
- Tax receivable agreement liability
- 317,495,000 US dollars
- Accounts payable, accrued expenses and other liabilities
- 175,244,000 US dollars
- Accrued compensation
- 158,766,000 US dollars
- Lease liabilities
- 150,337,000 US dollars
- Deferred tax liability
- 53,670,000 US dollars
- Deferred revenue
- 38,368,000 US dollars
- Payable and due to related parties
- 11,160,000 US dollars
- Payable to brokers and dealers and clearing organizations
- 7,649,000 US dollars
- Additional paid-in capital
- 4,931,516,000 US dollars
- Retained earnings
- 1,687,101,000 US dollars
- Accumulated other comprehensive income (loss)
- 15,912,000 US dollars
- Common stock, value - Class A Common Stock
- 1,000 US dollars
- Common stock, value - Class B Common Stock
- 1,000 US dollars
- Common stock, value - Class D Common Stock
- 0 US dollars
- Common stock, value - Class C Common Stock
- 0 US dollars
- Preferred stock, $0.00001 par value; 250,000,000 shares authorized; none issued or outstanding
- 0 US dollars
- Non-controlling interests
- 703,623,000 US dollars
Chart connections
- Assets equal liabilities plus consolidated equity. Consolidated equity includes noncontrolling interests when reported.
- Treasury shares and other negative equity contributions reduce equity.
Free to share unchanged, with credit to Plicit.ai · CC BY-NC-ND 4.0Download PNG
Product waitlist
Health Check and Teardown for your own company
A health check uncovers insights of your private books, not a public ticker. Join this list to get notified as soon as we go-live!