
TEXAS INSTRUMENTS INCORPORATED (TXN) FY2024 Annual Balance Sheet
As of 2024-12-31
Balance Sheet
As of 2024-12-31
Swipe to see the full flow
Chart details
TEXAS INSTRUMENTS INCORPORATED (TXN) FY2024 Annual Balance Sheet
Balance sheet as of 2024-12-31. The chart shows assets, liabilities and equity at that date.
- Assets
- 35,509,000,000 US dollars
- Current assets
- 15,026,000,000 US dollars
- Non-current assets
- 20,483,000,000 US dollars
- Liabilities
- 18,606,000,000 US dollars
- Current liabilities
- 3,643,000,000 US dollars
- Non-current liabilities
- 14,963,000,000 US dollars
- Equity
- 16,903,000,000 US dollars
- Property, plant and equipment at cost
- 15,254,000,000 US dollars. Part of Property, plant and equipment, drawn as one net amount.
- Accumulated depreciation
- negative 3,907,000,000 US dollars. Part of Property, plant and equipment, drawn as one net amount.
- Short-term investments
- 4,380,000,000 US dollars
- Cash and cash equivalents
- 3,200,000,000 US dollars
- Work in process
- 2,214,000,000 US dollars
- Finished goods
- 1,918,000,000 US dollars
- Accounts receivable, net of allowances of ($21) and ($16)
- 1,719,000,000 US dollars
- Prepaid expenses and other current assets
- 1,200,000,000 US dollars
- Raw materials
- 395,000,000 US dollars
- Property, plant and equipment
- 11,347,000,000 US dollars
- Goodwill
- 4,362,000,000 US dollars
- Other long-term assets
- 3,348,000,000 US dollars
- Deferred tax assets
- 936,000,000 US dollars
- Capitalized software licenses
- 257,000,000 US dollars
- Overfunded retirement plans
- 233,000,000 US dollars
- Accrued expenses and other liabilities
- 1,075,000,000 US dollars
- Accrued compensation
- 839,000,000 US dollars
- Accounts payable
- 820,000,000 US dollars
- Current portion of long-term debt
- 750,000,000 US dollars
- Income taxes payable
- 159,000,000 US dollars
- Long-term debt
- 12,846,000,000 US dollars
- Other long-term liabilities
- 1,954,000,000 US dollars
- Underfunded retirement plans
- 110,000,000 US dollars
- Deferred tax liabilities
- 53,000,000 US dollars
- Retained earnings
- 52,262,000,000 US dollars
- Paid-in capital
- 3,935,000,000 US dollars
- Common stock, $1 par value. Shares authorized – 2,400; shares issued – 1,741
- 1,741,000,000 US dollars
- Preferred stock, $25 par value. Shares authorized – 10; none issued
- 0 US dollars
- Treasury common stock at cost Shares: 2024 - 830; 2023 - 832
- negative 40,895,000,000 US dollars
- Accumulated other comprehensive income (loss), net of taxes (AOCI)
- negative 140,000,000 US dollars
- Gross equity (calculated)
- 57,938,000,000 US dollars. Net equity plus the magnitudes of its negative contributions equals gross positive equity. The negative contributions enter this reconciliation as add-backs; their filed signs stay negative.
Chart connections
- Assets equal liabilities plus consolidated equity. Consolidated equity includes noncontrolling interests when reported.
- Treasury shares and other negative equity contributions reduce equity.
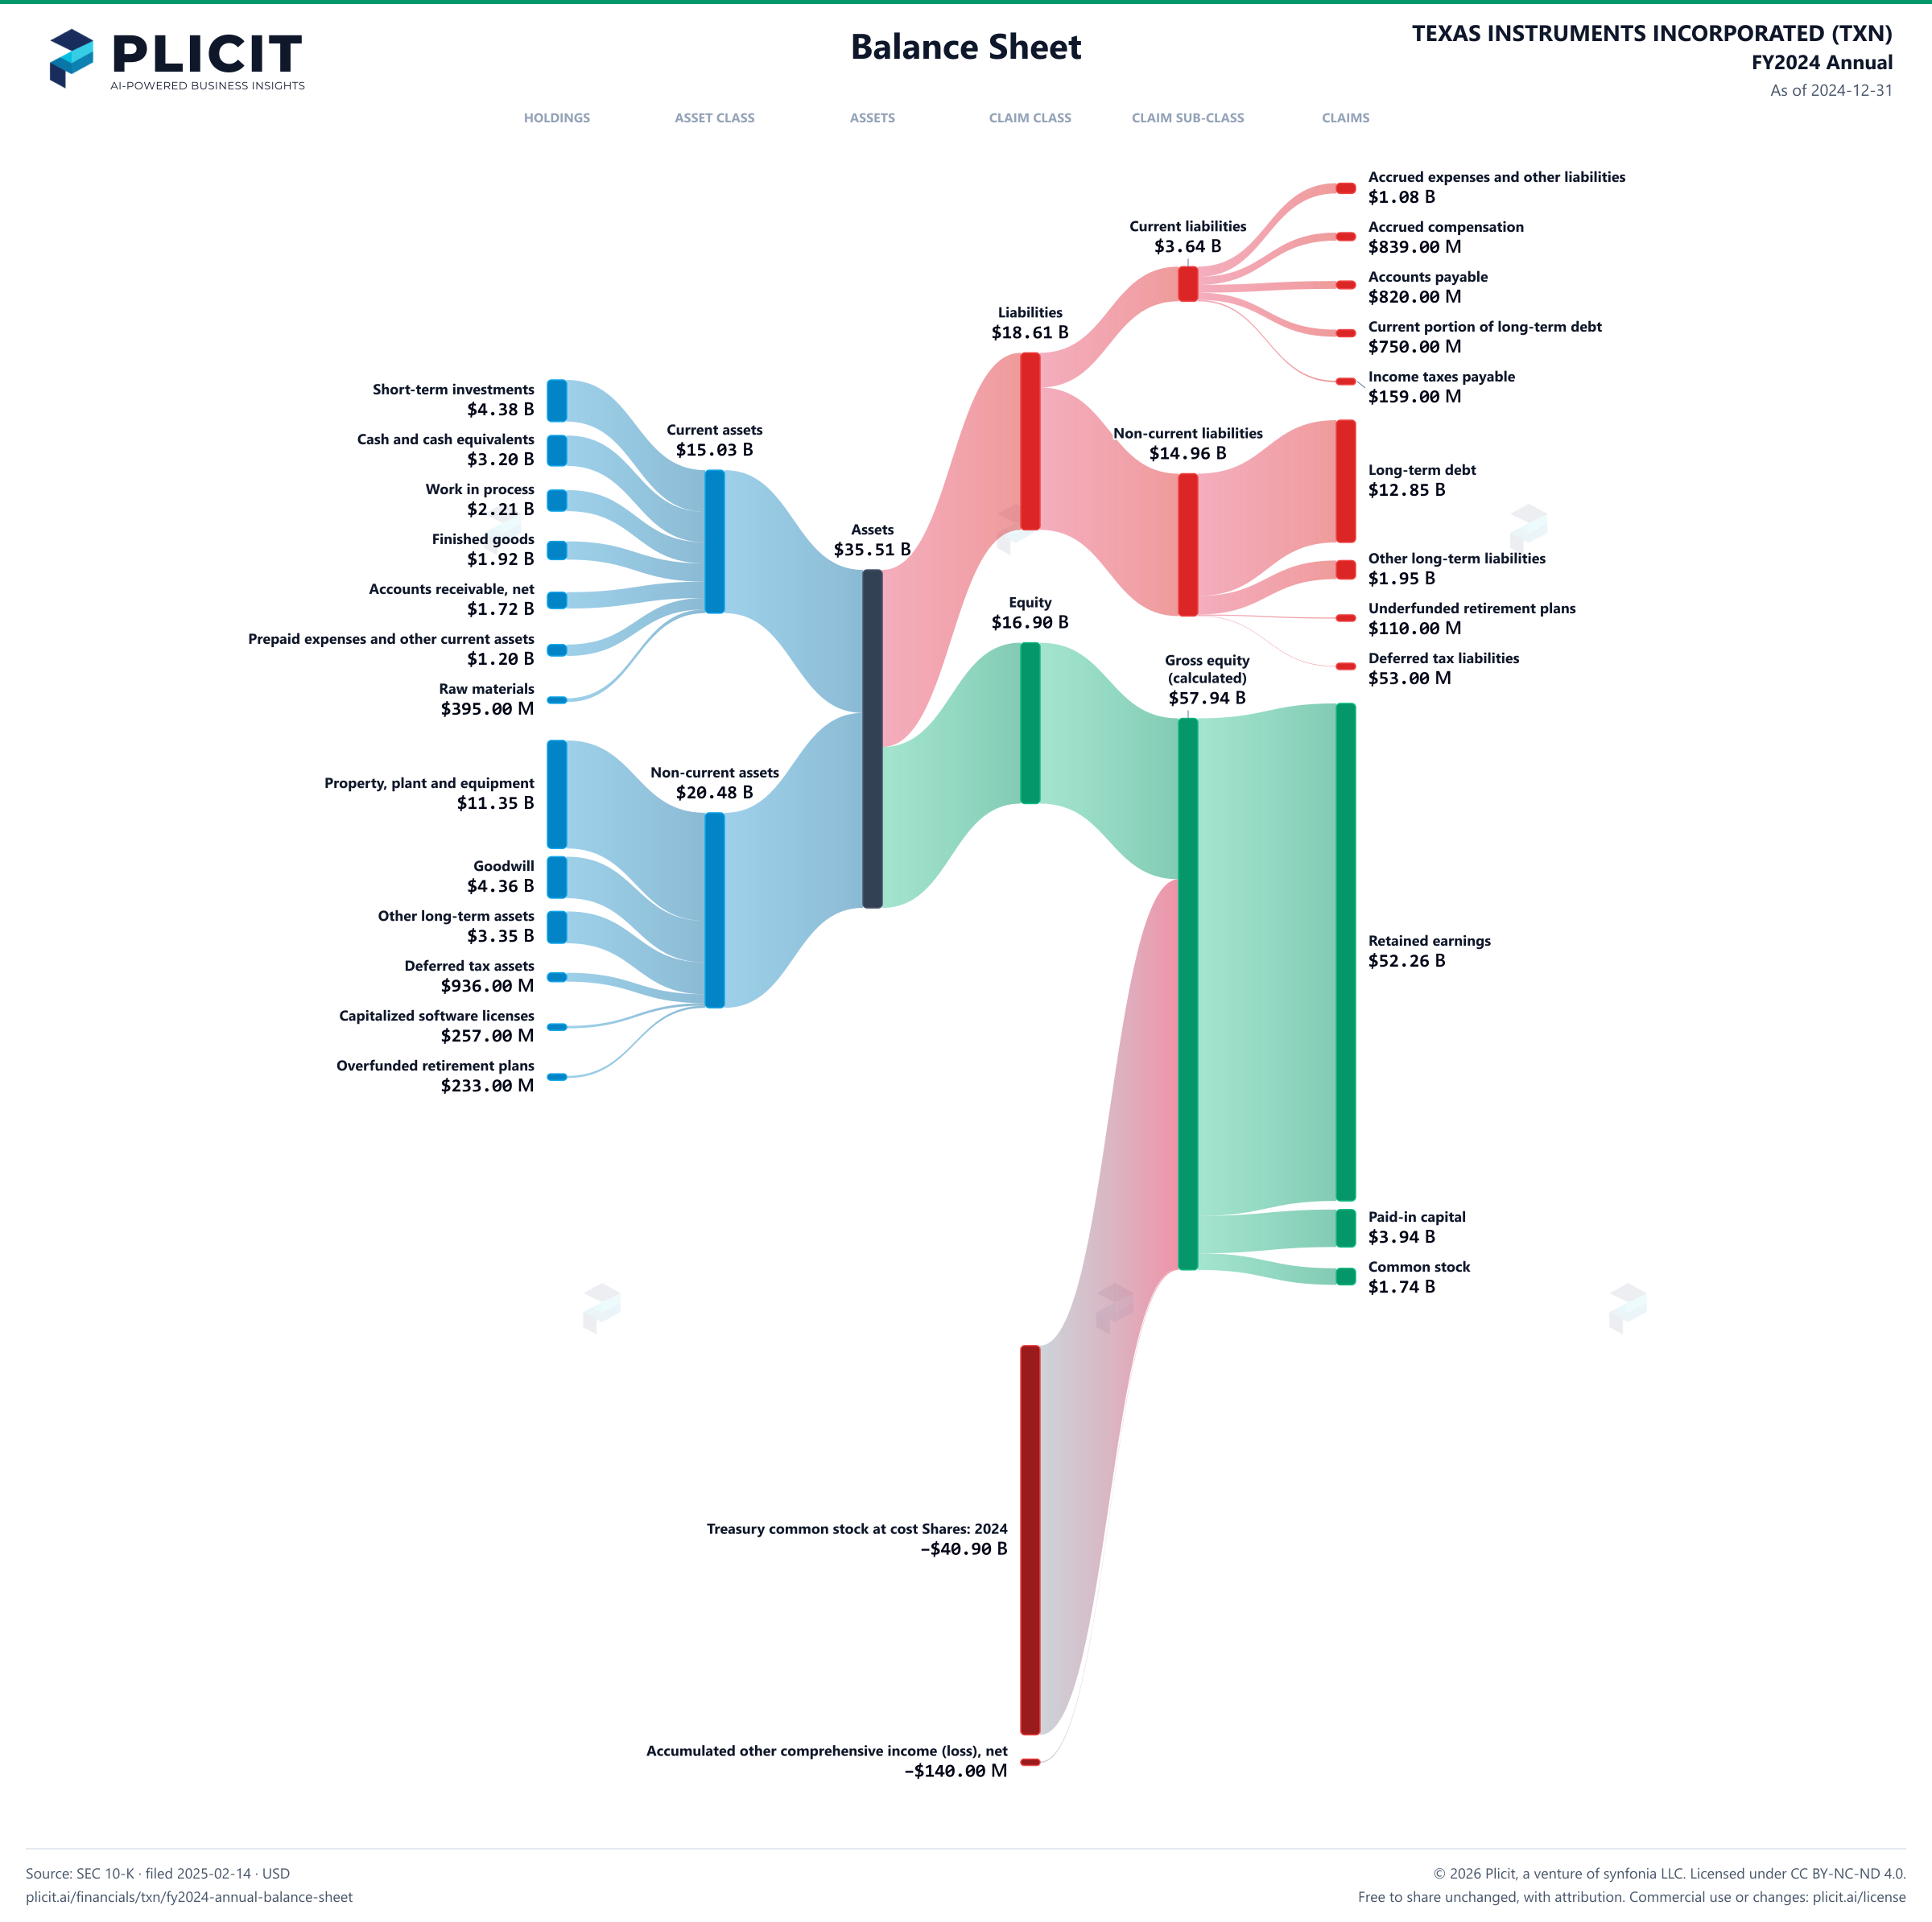
Free to share unchanged, with credit to Plicit.ai · CC BY-NC-ND 4.0Download PNG
Product waitlist
Health Check and Teardown for your own company
A health check uncovers insights of your private books, not a public ticker. Join this list to get notified as soon as we go-live!