
TEXAS INSTRUMENTS INCORPORATED (TXN) FY2024 Q3 Balance Sheet

Balance Sheet

As of 2024-09-30

Swipe to see the full flow
TEXAS INSTRUMENTS INCORPORATED (TXN) FY2024 Q3 Balance SheetBalance sheet as of 2024-09-30. The chart shows assets, liabilities and equity at that date.Current liabilities$3.69 BLiabilities$18.05 BCurrent assets$15.87 BNon-current liabilities$14.37 BAssets$35.32 BEquity$17.27 BGross equity(calculated)$57.86 BNon-current assets$19.45 BHOLDINGSASSET CLASSASSETSCLAIM CLASSCLAIM SUB-CLASSCLAIMSShort-term investmentsCash and cash equivalentsWork in processAccounts receivable, net of allowances of ($23) and ($16)Finished goodsPrepaid expenses and other current assetsRaw materialsProperty, plant and equipmentGoodwillOther long-term assetsDeferred tax assetsCapitalized software licensesOverfunded retirement plansCurrent portion of long-term debtAccrued expenses and other liabilitiesAccounts payableAccrued compensationIncome taxes payableLong-term debtOther long-term liabilitiesUnderfunded retirement plansDeferred tax liabilitiesRetained earningsPaid-in capitalCommon stock, $1 par value. Shares authorized – 2,400; shares issued – 1,741Current assetsNon-current assetsAssetsCurrent liabilitiesNon-current liabilitiesLiabilitiesEquityGross equity (calculated)Treasury common stock at cost Shares: September 30, 2024 – 829; December 31, 2023 – 832Accumulated other comprehensive income (loss), net of taxes (AOCI)Current portion of long-term debtCurrent portion of long-term debt$1.05 BAccrued expenses and other liabilitiesAccrued expenses and other liabilities$1.01 BCurrent liabilitiesCurrent liabilities$3.69 BAccounts payableAccounts payable$794.00 MLiabilitiesLiabilities$18.05 BAccrued compensationAccrued compensation$721.00 MIncome taxes payableIncome taxes payable$108.00 MShort-term investmentsShort-term investments$6.16 BCurrent assetsCurrent assets$15.87 BNon-current liabilitiesNon-current liabilities$14.37 BCash and cash equivalentsCash and cash equivalents$2.59 BLong-term debtLong-term debt$12.84 BWork in processWork in process$2.08 BAssetsAssets$35.32 BAccounts receivable, net of allowances of ($23) and ($16)Accounts receivable, net$1.86 BOther long-term liabilitiesOther long-term liabilities$1.35 BFinished goodsFinished goods$1.82 BEquityEquity$17.27 BUnderfunded retirement plansUnderfunded retirement plans$117.00 MPrepaid expenses and other current assetsPrepaid expenses and other current assets$962.00 MDeferred tax liabilitiesDeferred tax liabilities$54.00 MGross equity (calculated)Gross equity(calculated)$57.86 BRaw materialsRaw materials$393.00 MNon-current assetsNon-current assets$19.45 BProperty, plant and equipmentProperty, plant and equipment$11.80 BGoodwillGoodwill$4.36 BOther long-term assetsOther long-term assets$1.93 BRetained earningsRetained earnings$52.30 BDeferred tax assetsDeferred tax assets$941.00 MCapitalized software licensesCapitalized software licenses$229.00 MOverfunded retirement plansOverfunded retirement plans$184.00 MPaid-in capitalPaid-in capital$3.81 BCommon stock, $1 par value. Shares authorized – 2,400; shares issued – 1,741Common stock$1.74 BTreasury common stock at cost Shares: September 30, 2024 – 829; December 31, 2023 – 832Treasury common stock at cost Shares: September 30−$40.40 BAccumulated other comprehensive income (loss), net of taxes (AOCI)Accumulated other comprehensive income (loss), net−$195.00 M
Chart details

TEXAS INSTRUMENTS INCORPORATED (TXN) FY2024 Q3 Balance Sheet

Balance sheet as of 2024-09-30. The chart shows assets, liabilities and equity at that date.

Assets
35,321,000,000 US dollars
Current assets
15,872,000,000 US dollars
Non-current assets
19,449,000,000 US dollars
Liabilities
18,053,000,000 US dollars
Current liabilities
3,686,000,000 US dollars
Non-current liabilities
14,367,000,000 US dollars
Equity
17,268,000,000 US dollars
Property, plant and equipment at cost
15,464,000,000 US dollars. Part of Property, plant and equipment, drawn as one net amount.
Accumulated depreciation
negative 3,662,000,000 US dollars. Part of Property, plant and equipment, drawn as one net amount.
Short-term investments
6,163,000,000 US dollars
Cash and cash equivalents
2,589,000,000 US dollars
Work in process
2,081,000,000 US dollars
Accounts receivable, net of allowances of ($23) and ($16)
1,862,000,000 US dollars
Finished goods
1,822,000,000 US dollars
Prepaid expenses and other current assets
962,000,000 US dollars
Raw materials
393,000,000 US dollars
Property, plant and equipment
11,802,000,000 US dollars
Goodwill
4,362,000,000 US dollars
Other long-term assets
1,931,000,000 US dollars
Deferred tax assets
941,000,000 US dollars
Capitalized software licenses
229,000,000 US dollars
Overfunded retirement plans
184,000,000 US dollars
Current portion of long-term debt
1,049,000,000 US dollars
Accrued expenses and other liabilities
1,014,000,000 US dollars
Accounts payable
794,000,000 US dollars
Accrued compensation
721,000,000 US dollars
Income taxes payable
108,000,000 US dollars
Long-term debt
12,844,000,000 US dollars
Other long-term liabilities
1,352,000,000 US dollars
Underfunded retirement plans
117,000,000 US dollars
Deferred tax liabilities
54,000,000 US dollars
Retained earnings
52,304,000,000 US dollars
Paid-in capital
3,813,000,000 US dollars
Common stock, $1 par value. Shares authorized – 2,400; shares issued – 1,741
1,741,000,000 US dollars
Preferred stock, $25 par value. Shares authorized – 10; none issued
0 US dollars
Treasury common stock at cost Shares: September 30, 2024 – 829; December 31, 2023 – 832
negative 40,395,000,000 US dollars
Accumulated other comprehensive income (loss), net of taxes (AOCI)
negative 195,000,000 US dollars
Gross equity (calculated)
57,858,000,000 US dollars. Net equity plus the magnitudes of its negative contributions equals gross positive equity. The negative contributions enter this reconciliation as add-backs; their filed signs stay negative.

Chart connections

  • Assets equal liabilities plus consolidated equity. Consolidated equity includes noncontrolling interests when reported.
  • Treasury shares and other negative equity contributions reduce equity.
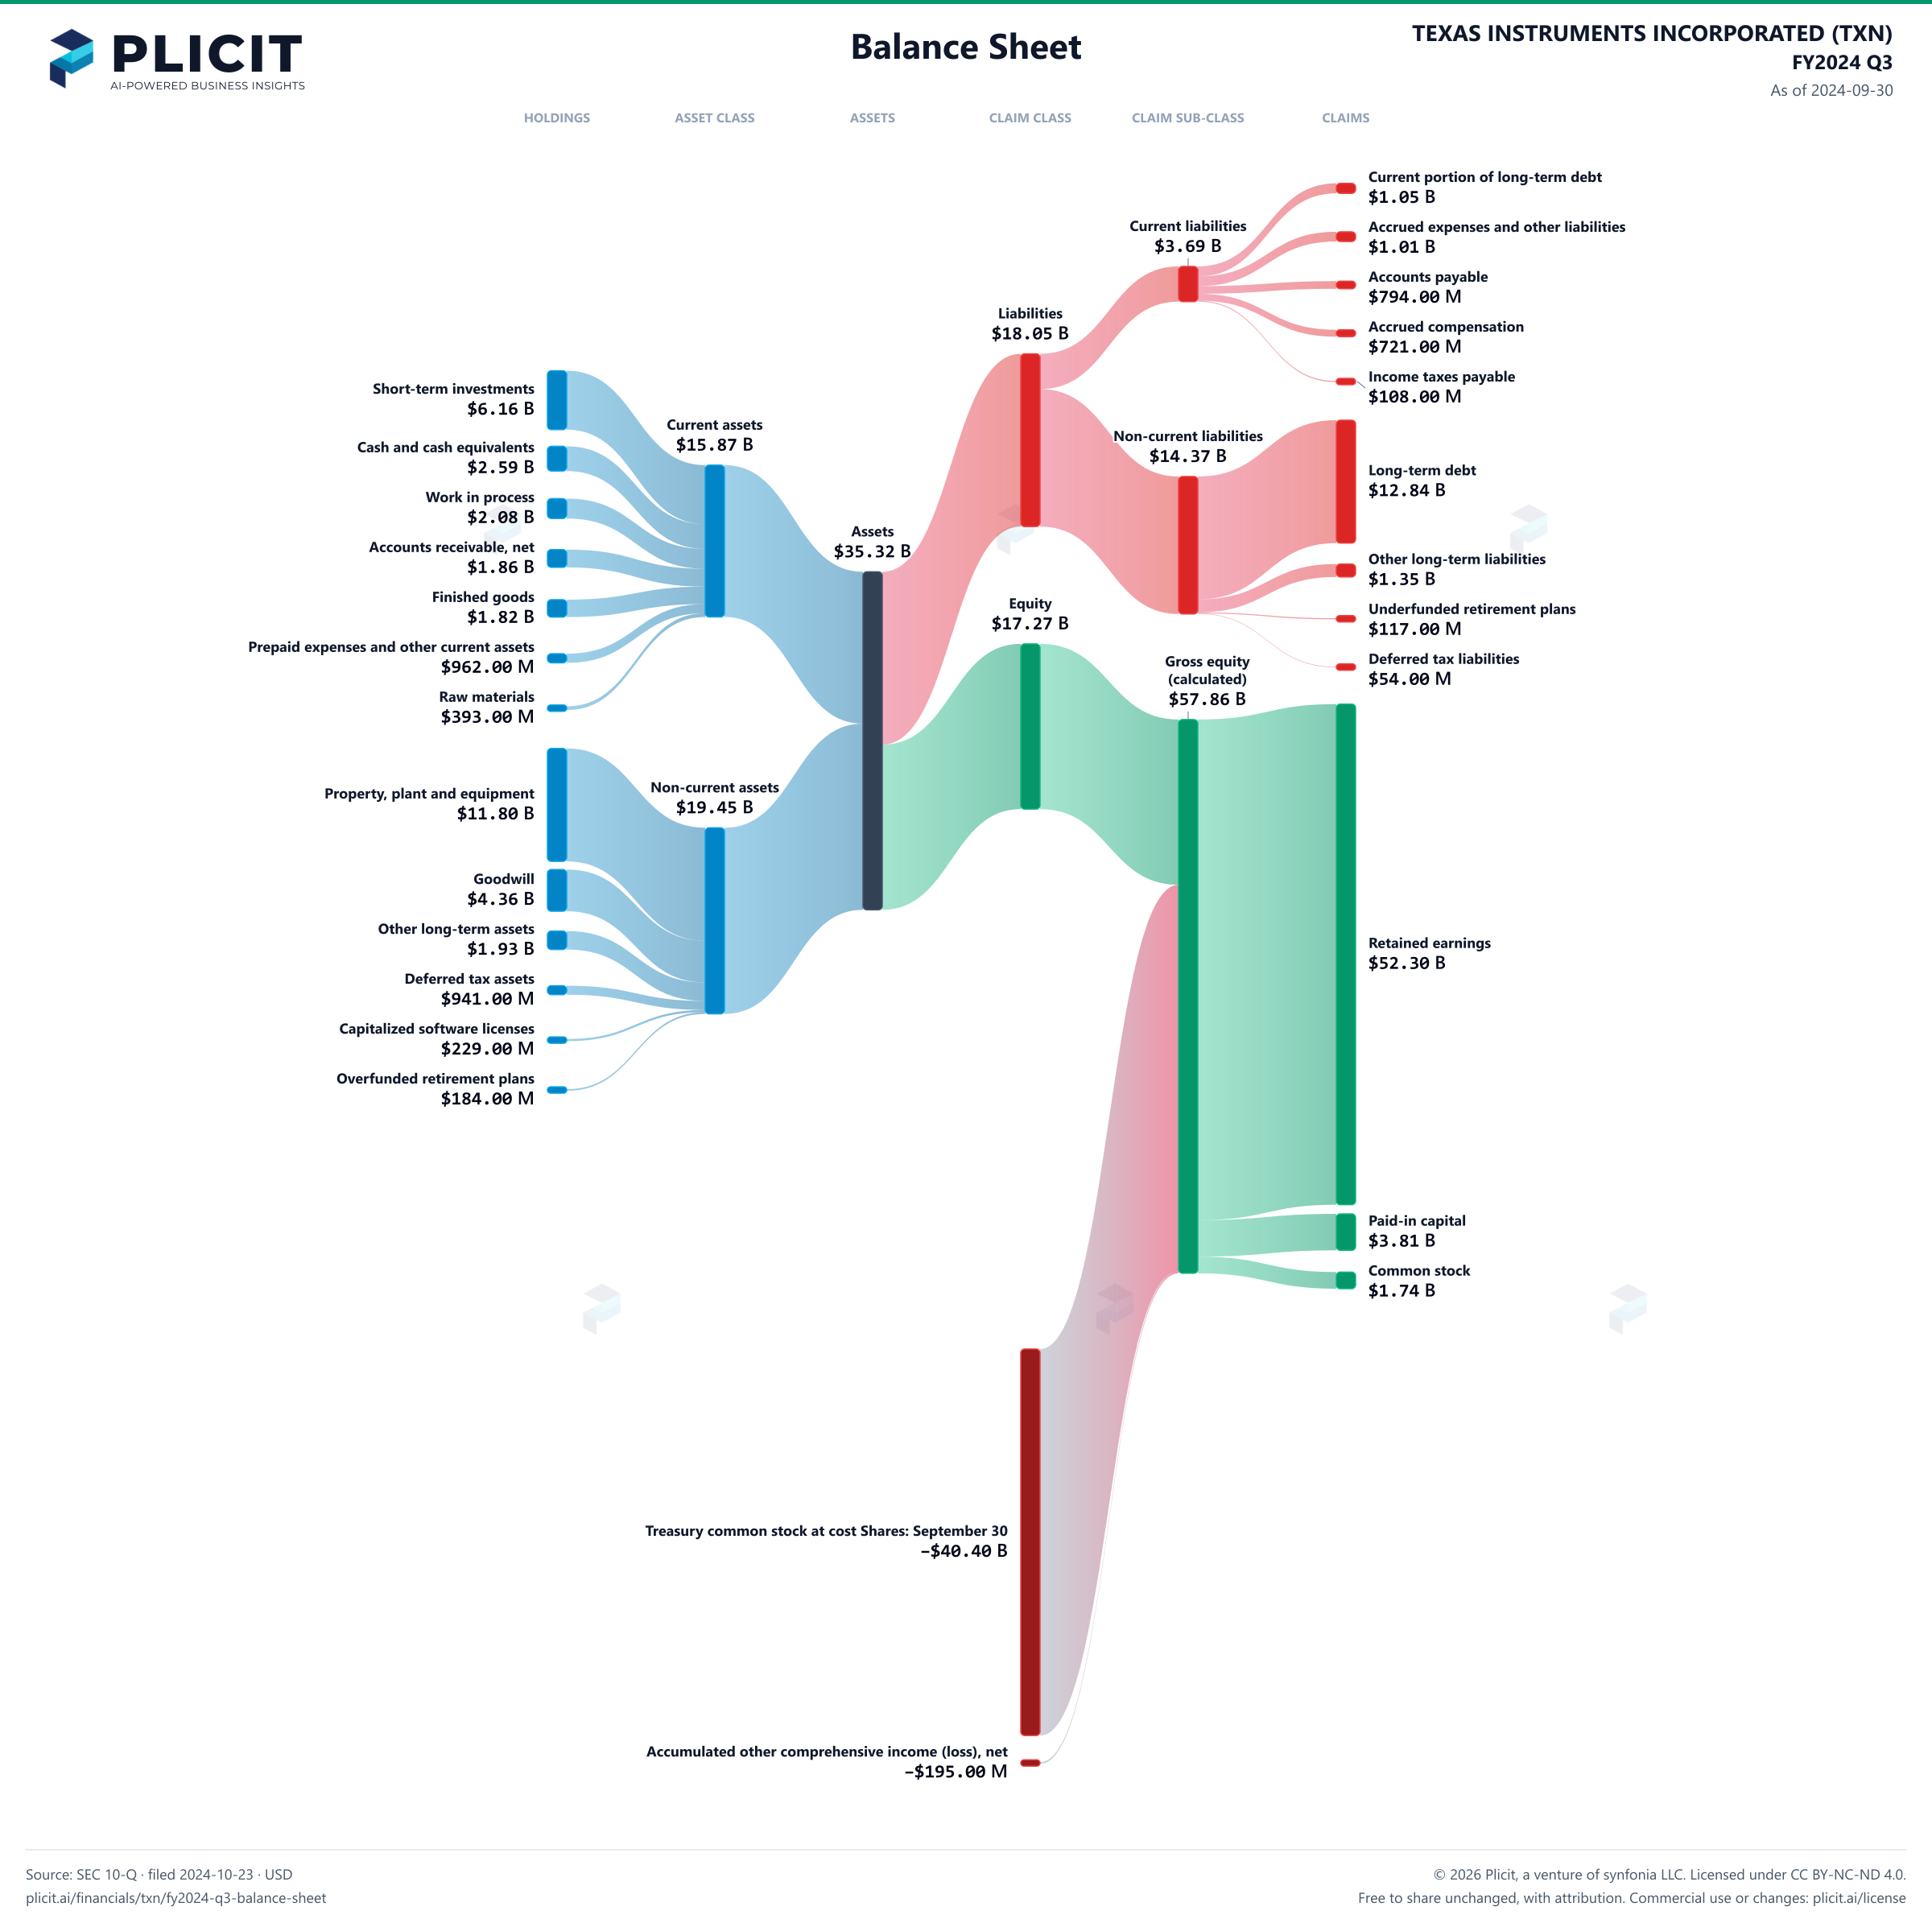
TEXAS INSTRUMENTS INCORPORATED (TXN) FY2024 Q3 Balance Sheet Sankey chart
Free to share unchanged, with credit to Plicit.ai · CC BY-NC-ND 4.0Download PNG

Newsletter

Get the teardowns by email

Subscribe if you want the public-company teardowns in your inbox when they're released.

Product waitlist

Health Check and Teardown for your own company

A health check uncovers insights of your private books, not a public ticker. Join this list to get notified as soon as we go-live!