
Vistra Corp. (VST) FY2024 Annual Balance Sheet
As of 2024-12-31
Balance Sheet
As of 2024-12-31
Swipe to see the full flow
Chart details
Vistra Corp. (VST) FY2024 Annual Balance Sheet
Balance sheet as of 2024-12-31. The chart shows assets, liabilities and equity at that date.
- Assets
- 37,770,000,000 US dollars
- Current assets
- 8,119,000,000 US dollars
- Non-current assets
- 29,651,000,000 US dollars
- Liabilities
- 32,187,000,000 US dollars
- Current liabilities
- 8,432,000,000 US dollars
- Non-current liabilities
- 23,755,000,000 US dollars
- Equity
- 5,583,000,000 US dollars
- Noncontrolling interest
- 13,000,000 US dollars. Included in consolidated equity; this amount is not added again.
- Commodity and other derivative contractual assets
- 2,587,000,000 US dollars
- Total trade accounts receivable — net
- 1,982,000,000 US dollars
- Cash and cash equivalents
- 1,188,000,000 US dollars
- Inventories
- 970,000,000 US dollars
- Prepaid expense and other current assets
- 515,000,000 US dollars
- Margin deposits posted under affiliate financing agreement
- 435,000,000 US dollars
- Margin deposits related to commodity contracts
- 406,000,000 US dollars
- Restricted cash
- 28,000,000 US dollars
- Income taxes receivable
- 8,000,000 US dollars
- Property, plant, and equipment — net
- 18,173,000,000 US dollars
- Investments
- 4,512,000,000 US dollars
- Goodwill
- 2,807,000,000 US dollars
- Identifiable intangible assets — net
- 2,213,000,000 US dollars
- Other noncurrent assets
- 1,191,000,000 US dollars
- Commodity and other derivative contractual assets
- 740,000,000 US dollars
- Accumulated deferred income taxes
- 9,000,000 US dollars
- Restricted cash
- 6,000,000 US dollars
- Commodity and other derivative contractual liabilities
- 3,351,000,000 US dollars
- Trade accounts payable
- 1,510,000,000 US dollars
- Long-term debt due currently
- 880,000,000 US dollars
- Accounts receivable financing
- 750,000,000 US dollars
- Forward repurchase obligation due currently
- 703,000,000 US dollars
- Other current liabilities
- 645,000,000 US dollars
- Accrued taxes other than income
- 209,000,000 US dollars
- Accrued interest
- 193,000,000 US dollars
- Asset retirement obligations
- 142,000,000 US dollars
- Margin deposits related to commodity contracts
- 49,000,000 US dollars
- Long-term debt, less amounts due currently
- 15,418,000,000 US dollars
- Asset retirement obligations
- 3,936,000,000 US dollars
- Commodity and other derivative contractual liabilities
- 1,367,000,000 US dollars
- Other noncurrent liabilities and deferred credits
- 1,256,000,000 US dollars
- Accumulated deferred income taxes
- 697,000,000 US dollars
- Forward repurchase obligation, less amounts due currently
- 632,000,000 US dollars
- Margin deposits financing with affiliate
- 435,000,000 US dollars
- Tax Receivable Agreement obligation
- 14,000,000 US dollars
- Additional paid-in-capital
- 9,435,000,000 US dollars
- Preferred stock (100,000,000 shares authorized, $1,000 liquidation preference per share, 2,476,066 and 2,476,081 shares outstanding at December 31, 2024 and 2023, respectively)
- 2,476,000,000 US dollars
- Accumulated other comprehensive income
- 20,000,000 US dollars
- Common stock (par value $0.01 per share, 1,800,000,000 shares authorized, 339,754,307 and 351,457,016 shares outstanding at December 31, 2024 and 2023, respectively)
- 5,000,000 US dollars
- Noncontrolling interest in subsidiary
- 13,000,000 US dollars
- Treasury stock, at cost (208,998,299 and 192,178,156 shares at December 31, 2024 and 2023, respectively)
- negative 5,912,000,000 US dollars
- Accumulated deficit
- negative 454,000,000 US dollars
- Gross equity (calculated)
- 11,949,000,000 US dollars. Net equity plus the magnitudes of its negative contributions equals gross positive equity. The negative contributions enter this reconciliation as add-backs; their filed signs stay negative.
Chart connections
- Assets equal liabilities plus consolidated equity. Consolidated equity includes noncontrolling interests when reported.
- Treasury shares and other negative equity contributions reduce equity.
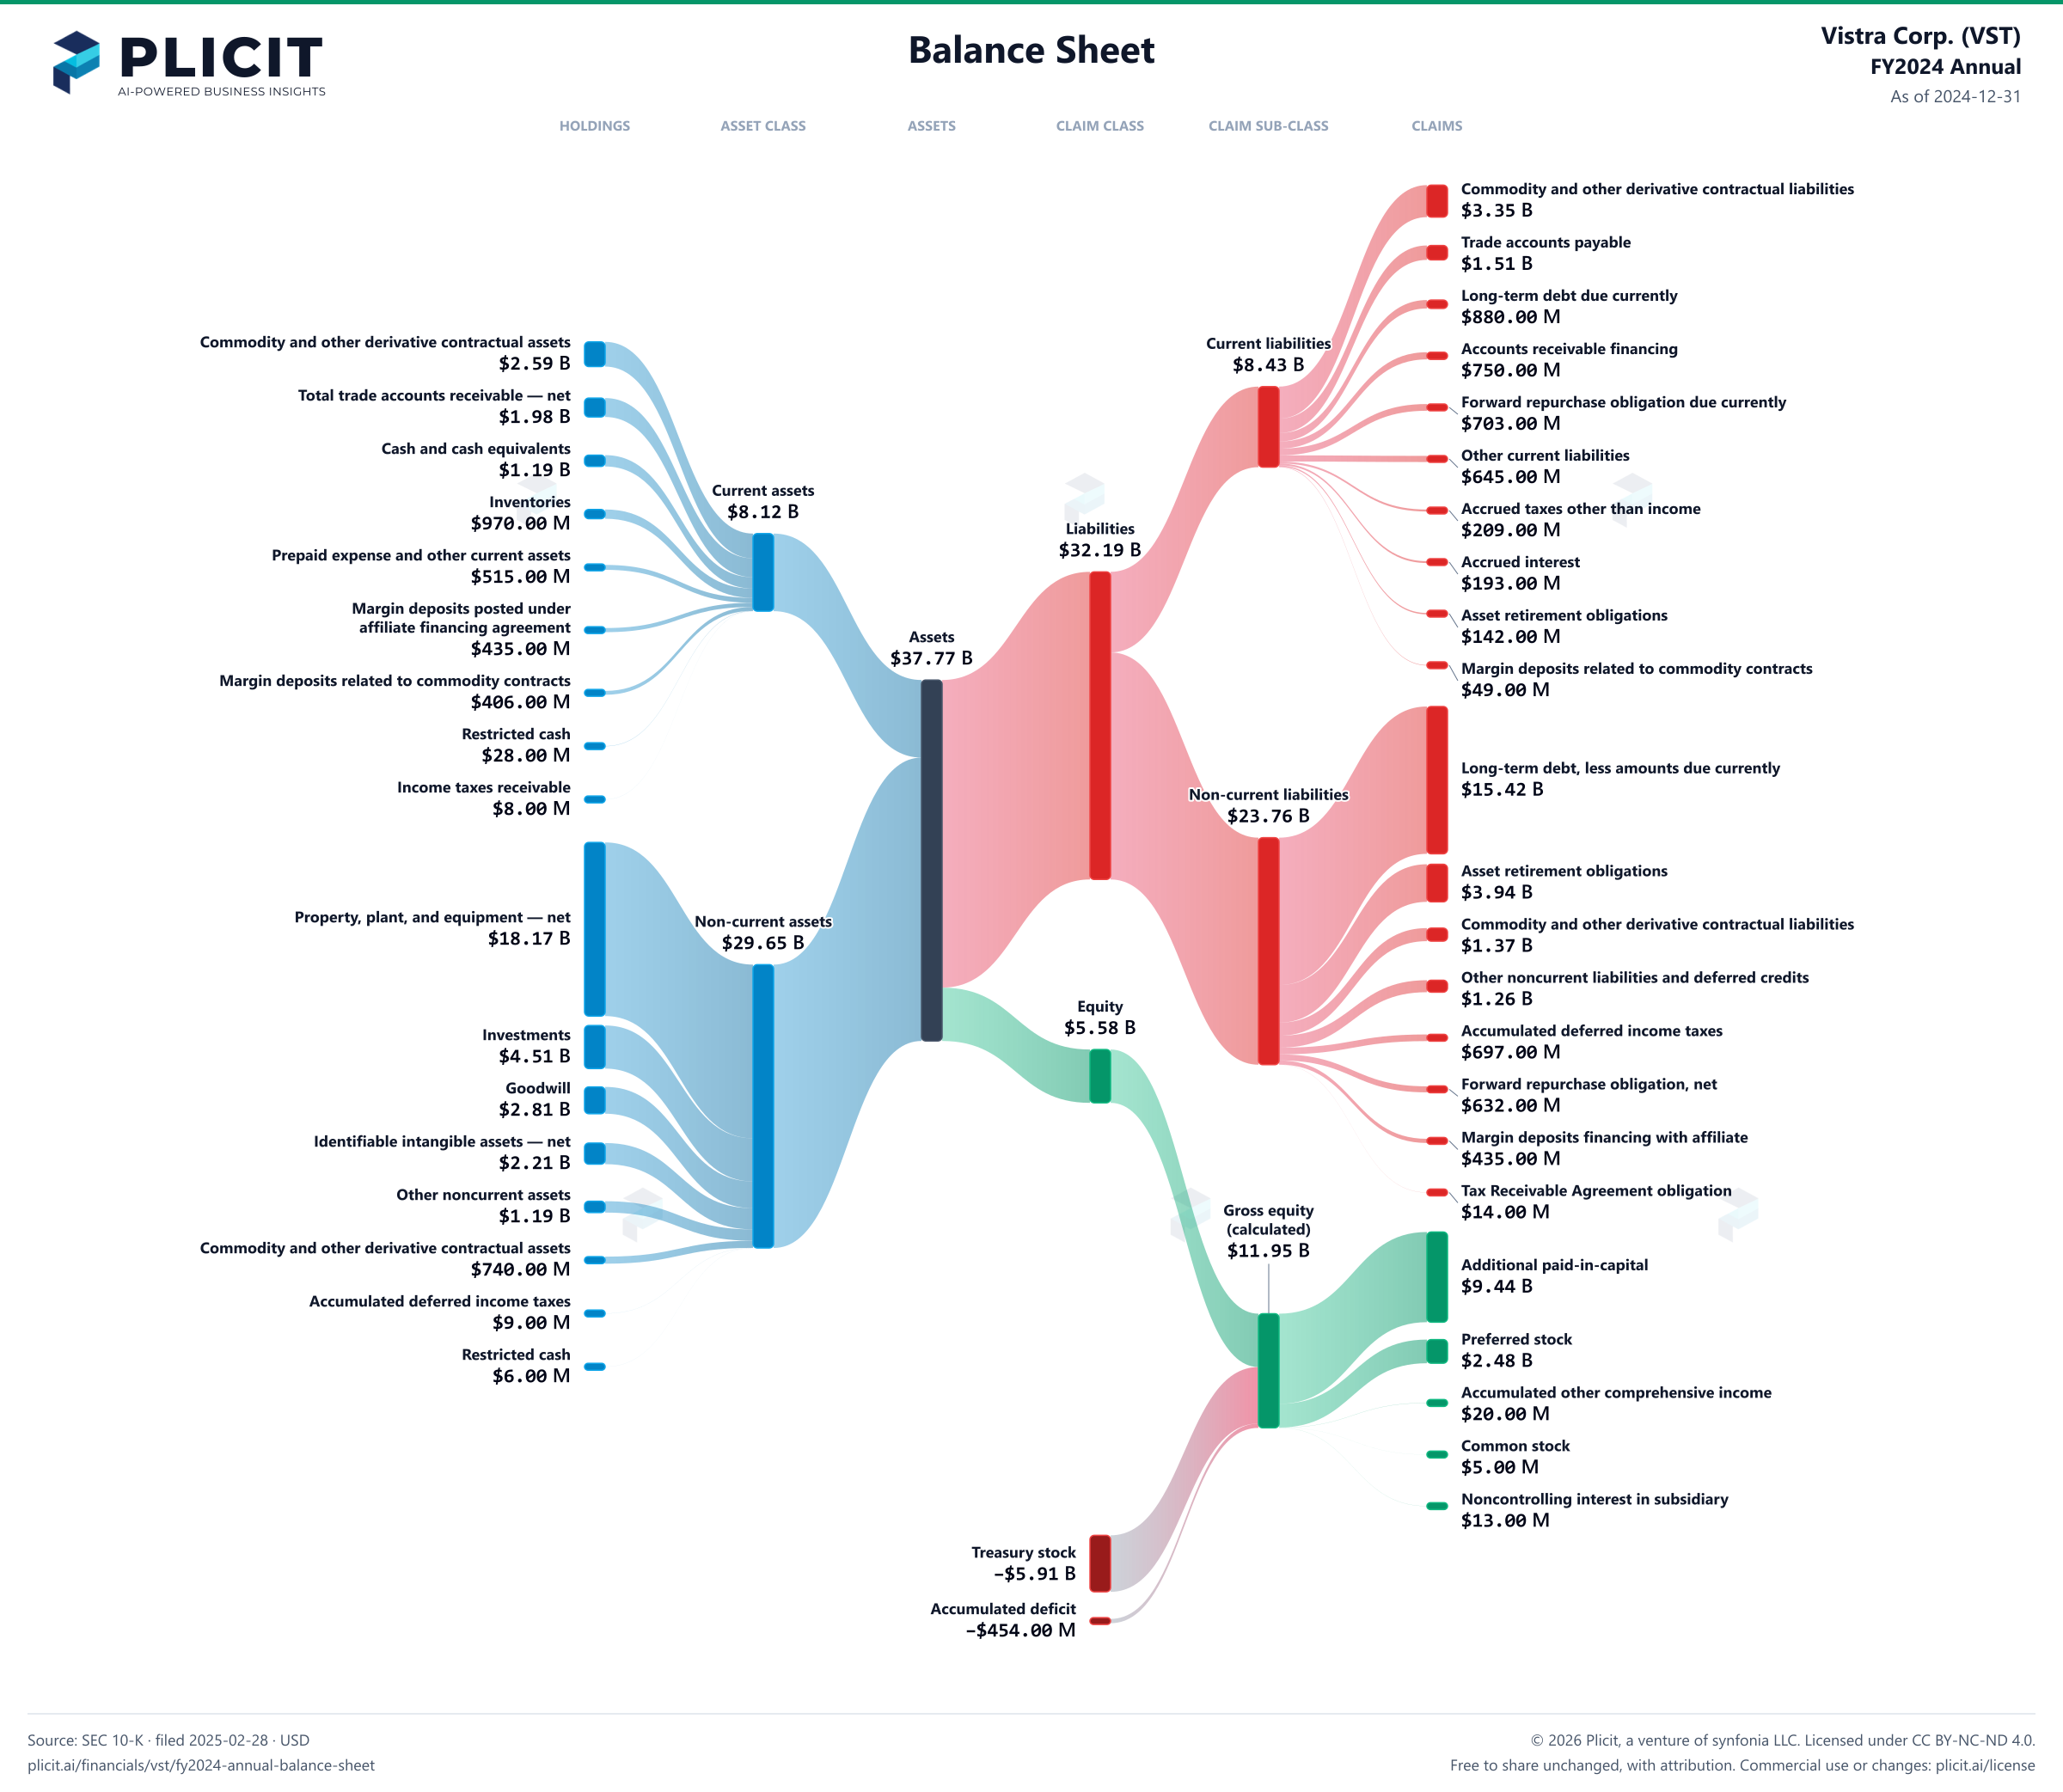
Free to share unchanged, with credit to Plicit.ai · CC BY-NC-ND 4.0Download PNG
Product waitlist
Health Check and Teardown for your own company
A health check uncovers insights of your private books, not a public ticker. Join this list to get notified as soon as we go-live!