
Balance Sheet

As of 2024-03-31

Swipe to see the full flow
Vistra Corp. (VST) FY2024 Q1 Balance SheetBalance sheet as of 2024-03-31. The chart shows assets, liabilities and equity at that date.Current liabilities$8.78 BCurrent assets$9.43 BLiabilities$30.89 BAssets$38.18 BNon-current liabilities$22.12 BNon-current assets$28.75 BEquity$7.28 BGross equity(calculated)$14.99 BHOLDINGSASSET CLASSASSETSCLAIM CLASSCLAIM SUB-CLASSCLAIMSCommodity and other derivative contractual assetsTrade accounts receivable — netMargin deposits related to commodity contractsCash and cash equivalentsInventoriesMargin deposits posted under affiliate financing agreementPrepaid expense and other current assetsRestricted cash included in current assetsIncome taxes receivableProperty, plant and equipment — netInvestmentsGoodwillIdentifiable intangible assets — netCommodity and other derivative contractual assetsOther noncurrent assetsOperating lease right-of-use assetsRestricted cash included in noncurrent assetsCommodity and other derivative contractual liabilitiesTrade accounts payableAccounts receivable financingShort-term borrowingsOther current liabilitiesAccrued interestAsset retirement obligationsAccrued taxes other than incomeMargin deposits related to commodity contractsLong-term debt due currentlyOperating lease liabilitiesTotal long-term debt less amounts due currentlyAsset retirement obligationCommodity and other derivative contractual liabilitiesTotal other noncurrent liabilities and deferred creditsMargin deposit financing with affiliateAccumulated deferred income taxesOperating lease liabilitiesTax Receivable Agreement obligationAdditional paid-in-capitalPreferred stock, number of shares authorized — 100,000,000; Series A (liquidation preference — $1,000; shares outstanding: March 31, 2024 and December 31, 2023— 1,000,000); Series B (liquidation preference — $1,000; shares outstanding: March 31, 2024 and December 31, 2023 — 1,000,000); Series C (liquidation preference — $1,000; shares outstanding: March 31, 2024 and December 31, 2023 — 476,081)Accumulated other comprehensive incomeCommon stock (par value — $0.01; number of shares authorized — 1,800,000,000) (shares outstanding: March 31, 2024 — 348,733,986; December 31, 2023 — 351,457,016)Noncontrolling interest in subsidiaryCurrent assetsNon-current assetsAssetsCurrent liabilitiesNon-current liabilitiesLiabilitiesEquityGross equity (calculated)Treasury stock, at cost (shares: March 31, 2024 — 198,562,722; December 31, 2023 — 192,178,156)Retained deficitCommodity and other derivative contractual liabilitiesCommodity and other derivative contractual liabilities$5.21 BTrade accounts payableTrade accounts payable$1.10 BAccounts receivable financingAccounts receivable financing$875.00 MShort-term borrowingsShort-term borrowings$500.00 MCurrent liabilitiesCurrent liabilities$8.78 BCommodity and other derivative contractual assetsCommodity and other derivative contractual assets$3.56 BOther current liabilitiesOther current liabilities$461.00 MTrade accounts receivable — netTrade accounts receivable — net$1.73 BAccrued interestAccrued interest$208.00 MMargin deposits related to commodity contractsMargin deposits related to commodity contracts$1.19 BAsset retirement obligationsAsset retirement obligations$119.00 MCurrent assetsCurrent assets$9.43 BCash and cash equivalentsCash and cash equivalents$1.07 BAccrued taxes other than incomeAccrued taxes other than income$118.00 MLiabilitiesLiabilities$30.89 BInventoriesInventories$976.00 MMargin deposits related to commodity contractsMargin deposits related to commodity contracts$115.00 MMargin deposits posted under affiliate financing agreementMargin deposits posted underaffiliate financing agreement$443.00 MLong-term debt due currentlyLong-term debt due currently$54.00 MAssetsAssets$38.18 BOperating lease liabilitiesOperating lease liabilities$11.00 MPrepaid expense and other current assetsPrepaid expense and other current assets$439.00 MRestricted cash included in current assetsRestricted cash included in current assets$32.00 MTotal long-term debt less amounts due currentlyTotal long-term debt less amounts due currently$14.69 BIncome taxes receivableIncome taxes receivable$1.00 MNon-current liabilitiesNon-current liabilities$22.12 BAsset retirement obligationAsset retirement obligation$3.81 BProperty, plant and equipment — netProperty, plant and equipment — net$18.01 BNon-current assetsNon-current assets$28.75 BCommodity and other derivative contractual liabilitiesCommodity and other derivative contractual liabilities$1.89 BTotal other noncurrent liabilities and deferred creditsTotal other noncurrent liabilities and deferred credits$1.10 BEquityEquity$7.28 BInvestmentsInvestments$4.22 BMargin deposit financing with affiliateMargin deposit financing with affiliate$443.00 MAccumulated deferred income taxesAccumulated deferred income taxes$118.00 MGoodwillGoodwill$2.88 BOperating lease liabilitiesOperating lease liabilities$56.00 MIdentifiable intangible assets — netIdentifiable intangible assets — net$2.28 BTax Receivable Agreement obligationTax Receivable Agreement obligation$15.00 MCommodity and other derivative contractual assetsCommodity and other derivative contractual assets$703.00 MOther noncurrent assetsOther noncurrent assets$578.00 MGross equity (calculated)Gross equity(calculated)$14.99 BAdditional paid-in-capitalAdditional paid-in-capital$10.88 BOperating lease right-of-use assetsOperating lease right-of-use assets$62.00 MRestricted cash included in noncurrent assetsRestricted cash included in noncurrent assets$14.00 MPreferred stock, number of shares authorized — 100,000,000; Series A (liquidation preference — $1,000; shares outstanding: March 31, 2024 and December 31, 2023— 1,000,000); Series B (liquidation preference — $1,000; shares outstanding: March 31, 2024 and December 31, 2023 — 1,000,000); Series C (liquidation preference — $1,000; shares outstanding: March 31, 2024 and December 31, 2023 — 476,081)Preferred stock, number of shares authorized— 100,000,000; Series A; Series B; Series C$2.48 BAccumulated other comprehensive incomeAccumulated other comprehensive income$6.00 MCommon stock (par value — $0.01; number of shares authorized — 1,800,000,000) (shares outstanding: March 31, 2024 — 348,733,986; December 31, 2023 — 351,457,016)Common stock$5.00 MNoncontrolling interest in subsidiaryNoncontrolling interest in subsidiary$1.63 BTreasury stock, at cost (shares: March 31, 2024 — 198,562,722; December 31, 2023 — 192,178,156)Treasury stock−$4.95 BRetained deficitRetained deficit−$2.76 B
Chart details

Vistra Corp. (VST) FY2024 Q1 Balance Sheet

Balance sheet as of 2024-03-31. The chart shows assets, liabilities and equity at that date.

Assets
38,178,000,000 US dollars
Current assets
9,433,000,000 US dollars
Non-current assets
28,745,000,000 US dollars
Liabilities
30,894,000,000 US dollars
Current liabilities
8,775,000,000 US dollars
Non-current liabilities
22,119,000,000 US dollars
Equity
7,284,000,000 US dollars
Noncontrolling interest
1,628,000,000 US dollars. Included in consolidated equity; this amount is not added again.
Commodity and other derivative contractual assets
3,557,000,000 US dollars
Trade accounts receivable — net
1,729,000,000 US dollars
Margin deposits related to commodity contracts
1,186,000,000 US dollars
Cash and cash equivalents
1,070,000,000 US dollars
Inventories
976,000,000 US dollars
Margin deposits posted under affiliate financing agreement
443,000,000 US dollars
Prepaid expense and other current assets
439,000,000 US dollars
Restricted cash included in current assets
32,000,000 US dollars
Income taxes receivable
1,000,000 US dollars
Property, plant and equipment — net
18,014,000,000 US dollars
Investments
4,219,000,000 US dollars
Goodwill
2,877,000,000 US dollars
Identifiable intangible assets — net
2,278,000,000 US dollars
Commodity and other derivative contractual assets
703,000,000 US dollars
Other noncurrent assets
578,000,000 US dollars
Operating lease right-of-use assets
62,000,000 US dollars
Restricted cash included in noncurrent assets
14,000,000 US dollars
Accumulated deferred income taxes
0 US dollars
Commodity and other derivative contractual liabilities
5,214,000,000 US dollars
Trade accounts payable
1,100,000,000 US dollars
Accounts receivable financing
875,000,000 US dollars
Short-term borrowings
500,000,000 US dollars
Other current liabilities
461,000,000 US dollars
Accrued interest
208,000,000 US dollars
Asset retirement obligations
119,000,000 US dollars
Accrued taxes other than income
118,000,000 US dollars
Margin deposits related to commodity contracts
115,000,000 US dollars
Long-term debt due currently
54,000,000 US dollars
Operating lease liabilities
11,000,000 US dollars
Total long-term debt less amounts due currently
14,693,000,000 US dollars
Asset retirement obligation
3,806,000,000 US dollars
Commodity and other derivative contractual liabilities
1,892,000,000 US dollars
Total other noncurrent liabilities and deferred credits
1,096,000,000 US dollars
Margin deposit financing with affiliate
443,000,000 US dollars
Accumulated deferred income taxes
118,000,000 US dollars
Operating lease liabilities
56,000,000 US dollars
Tax Receivable Agreement obligation
15,000,000 US dollars
Additional paid-in-capital
10,878,000,000 US dollars
Preferred stock, number of shares authorized — 100,000,000; Series A (liquidation preference — $1,000; shares outstanding: March 31, 2024 and December 31, 2023— 1,000,000); Series B (liquidation preference — $1,000; shares outstanding: March 31, 2024 and December 31, 2023 — 1,000,000); Series C (liquidation preference — $1,000; shares outstanding: March 31, 2024 and December 31, 2023 — 476,081)
2,476,000,000 US dollars
Accumulated other comprehensive income
6,000,000 US dollars
Common stock (par value — $0.01; number of shares authorized — 1,800,000,000) (shares outstanding: March 31, 2024 — 348,733,986; December 31, 2023 — 351,457,016)
5,000,000 US dollars
Noncontrolling interest in subsidiary
1,628,000,000 US dollars
Treasury stock, at cost (shares: March 31, 2024 — 198,562,722; December 31, 2023 — 192,178,156)
negative 4,947,000,000 US dollars
Retained deficit
negative 2,762,000,000 US dollars
Gross equity (calculated)
14,993,000,000 US dollars. Net equity plus the magnitudes of its negative contributions equals gross positive equity. The negative contributions enter this reconciliation as add-backs; their filed signs stay negative.

Chart connections

  • Assets equal liabilities plus consolidated equity. Consolidated equity includes noncontrolling interests when reported.
  • Treasury shares and other negative equity contributions reduce equity.
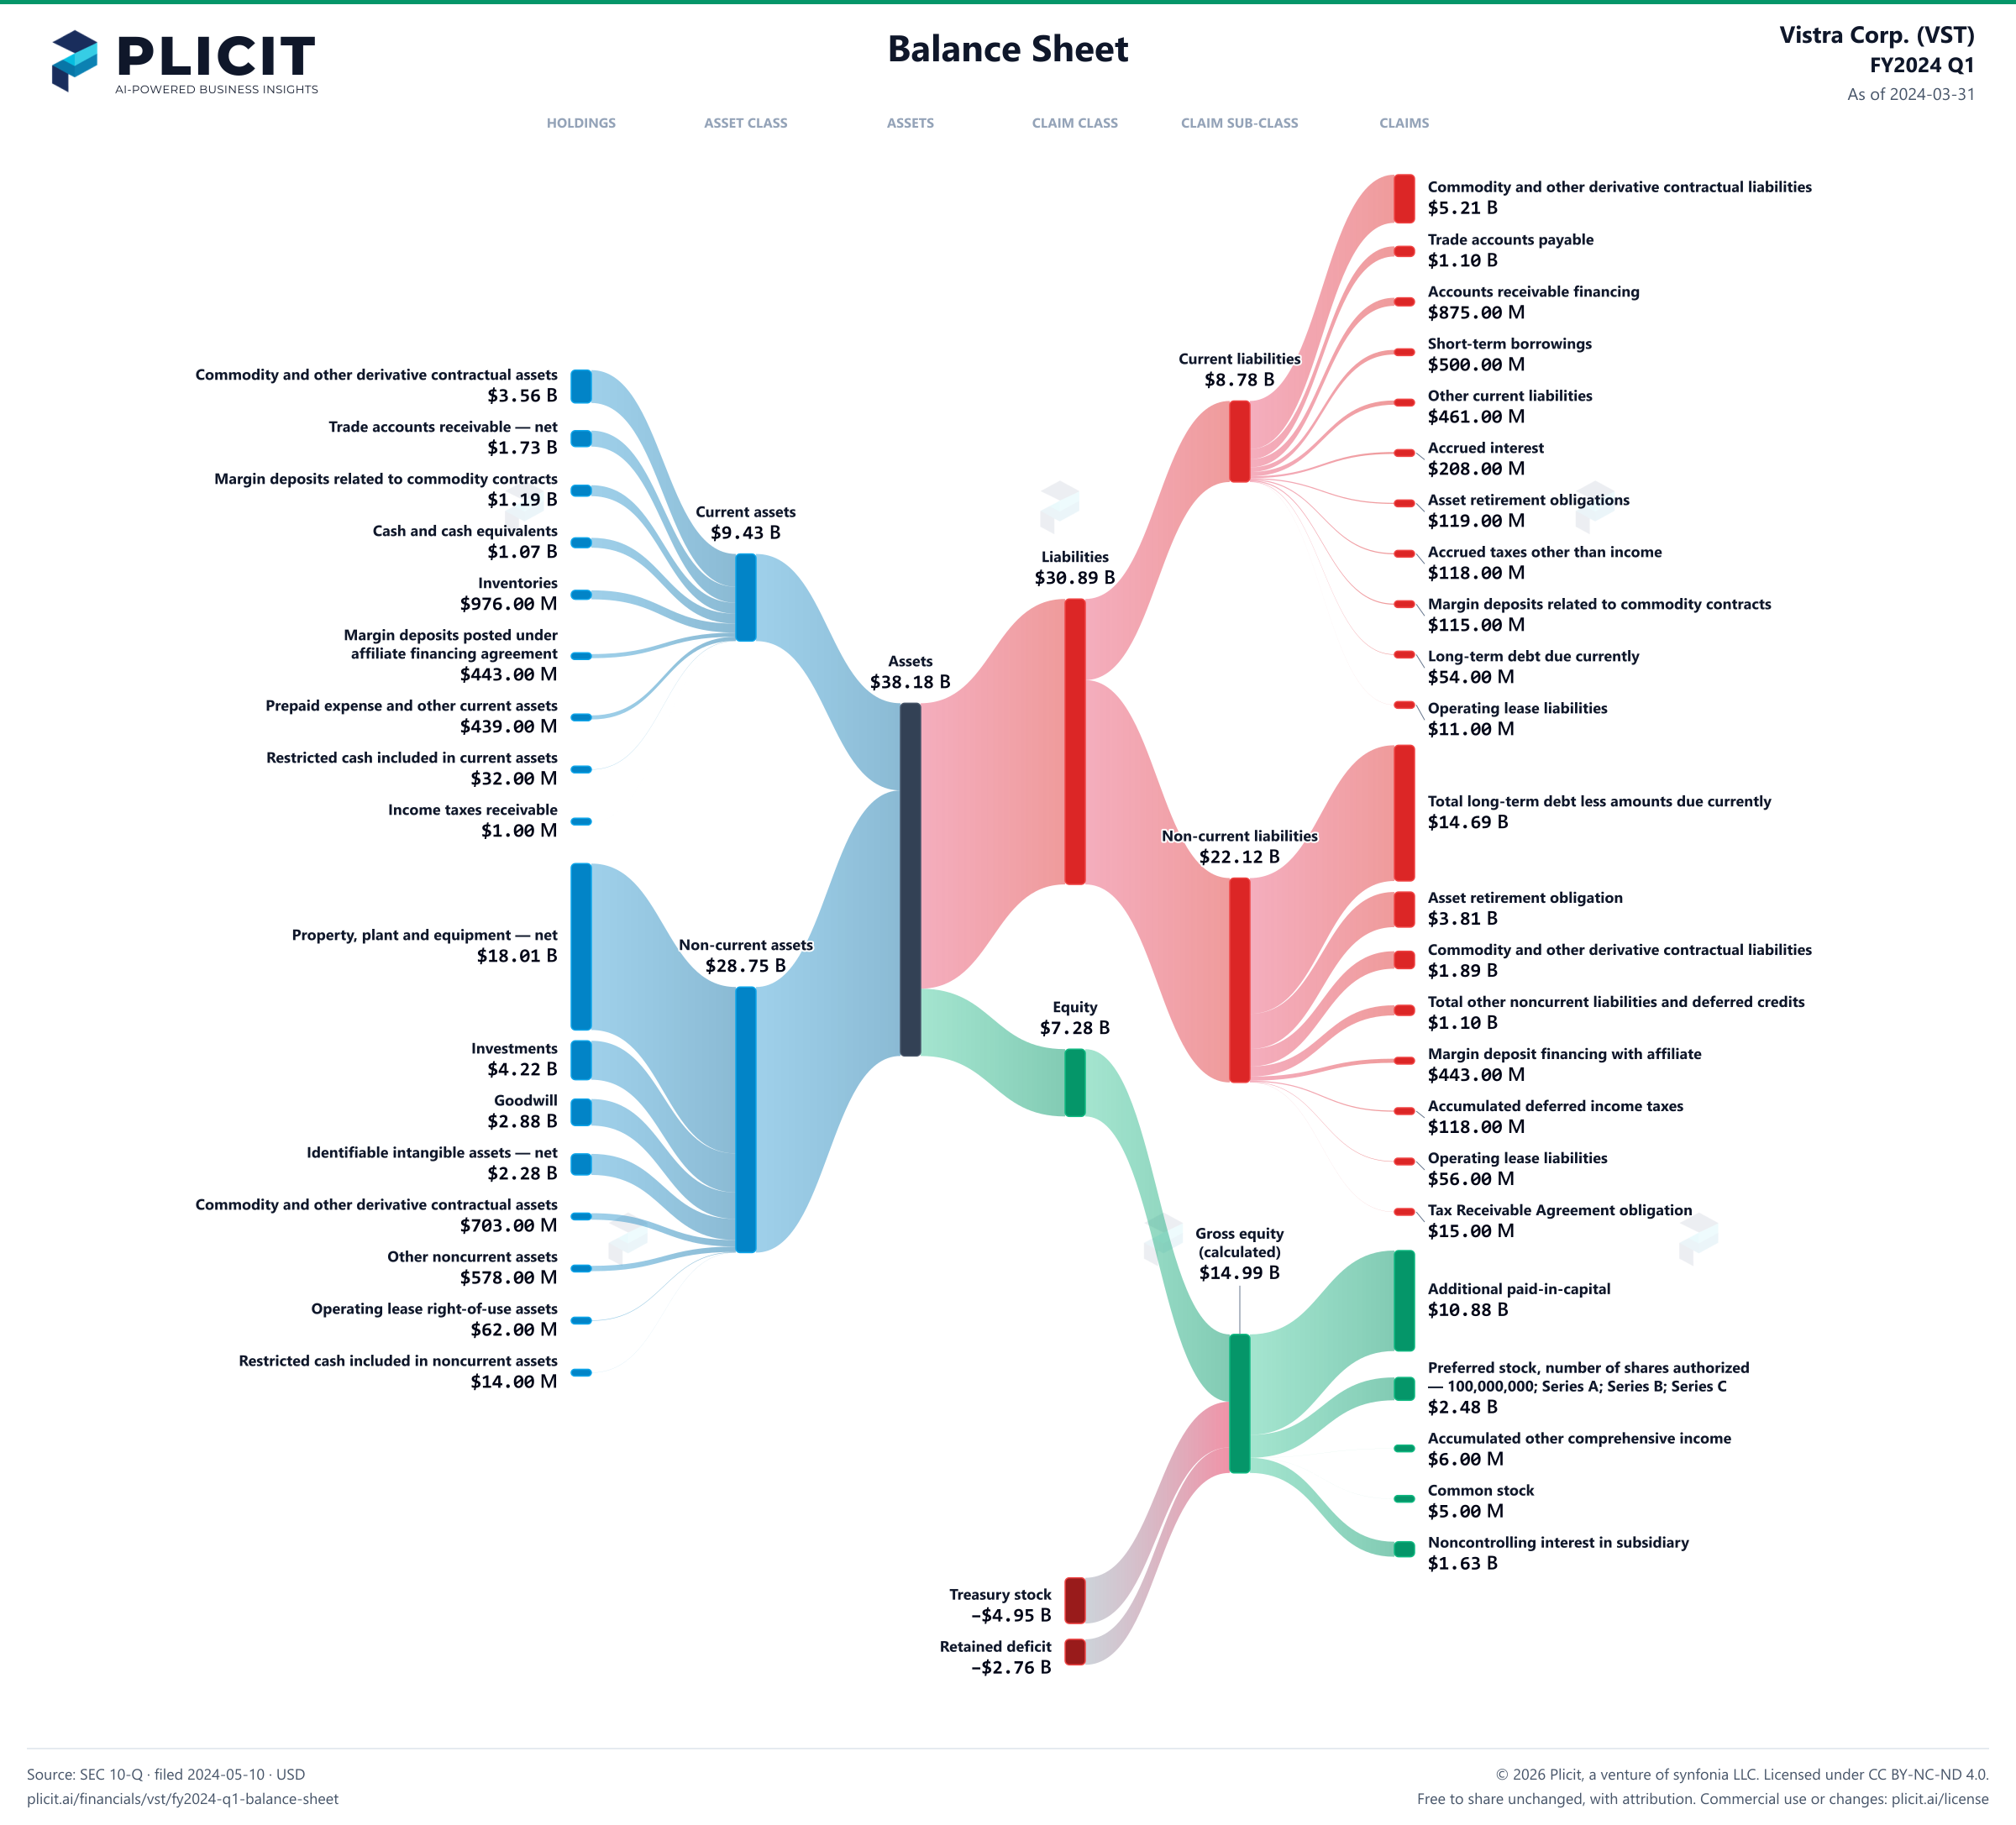
Vistra Corp. (VST) FY2024 Q1 Balance Sheet Sankey chart
Free to share unchanged, with credit to Plicit.ai · CC BY-NC-ND 4.0Download PNG

Newsletter

Get the teardowns by email

Subscribe if you want the public-company teardowns in your inbox when they're released.

Product waitlist

Health Check and Teardown for your own company

A health check uncovers insights of your private books, not a public ticker. Join this list to get notified as soon as we go-live!