
WASTE CONNECTIONS, INC. (WCN) FY2025 Annual P&L / Income Statement
2025-01-01 to 2025-12-31
Revenue by Business Segment (12 categories)
2025-01-01 to 2025-12-31
Swipe to see the full flow
Chart details
WASTE CONNECTIONS, INC. (WCN) FY2025 Annual P&L / Income Statement
Income statement for 2025-01-01 through 2025-12-31. View: Business segment (12 categories). Revenue uses this breakdown; costs and expenses retain the consolidated categories.
- Revenues
- 9,466,915,000 US dollars
- Cost of operations
- 5,455,382,000 US dollars
- Gross profit (calculated)
- 4,011,533,000 US dollars
- Operating expenses (calculated)
- 2,301,359,000 US dollars
- Operating income
- 1,710,174,000 US dollars
- Other income (expense), net (calculated)
- negative 292,258,000 US dollars
- Income before income tax provision
- 1,417,916,000 US dollars
- Income tax provision
- 341,359,000 US dollars
- Net income
- 1,076,557,000 US dollars
- Southern
- 2,146,478,000 US dollars
- Eastern
- 2,049,734,000 US dollars
- Western
- 2,111,672,000 US dollars
- Central
- 1,783,274,000 US dollars
- Canada
- 1,461,895,000 US dollars
- MidSouth
- 1,302,866,000 US dollars
- Selling, general and administrative
- 959,544,000 US dollars
- Depreciation
- 1,030,565,000 US dollars
- Amortization of intangibles
- 201,541,000 US dollars
- Impairments and other operating items
- 109,709,000 US dollars
- Revenue before reconciliation (calculated)
- 10,855,919,000 US dollars. Sum of the reported revenue categories before the separately reported reconciliation.
- Southern
- negative 238,669,000 US dollars. Reported reconciliation to consolidated revenue.
- Eastern
- negative 347,487,000 US dollars. Reported reconciliation to consolidated revenue.
- Western
- negative 262,253,000 US dollars. Reported reconciliation to consolidated revenue.
- Central
- negative 193,389,000 US dollars. Reported reconciliation to consolidated revenue.
- Canada
- negative 137,018,000 US dollars. Reported reconciliation to consolidated revenue.
- MidSouth
- negative 210,188,000 US dollars. Reported reconciliation to consolidated revenue.
Chart connections
- Revenue less cost of revenue equals gross profit; gross profit less operating expenses equals operating income.
- Operating income plus other income or expense equals income before tax. Income before tax less income tax expense or benefit equals net income.
- Reported revenue categories plus the separately reported signed reconciliation equals consolidated revenue.
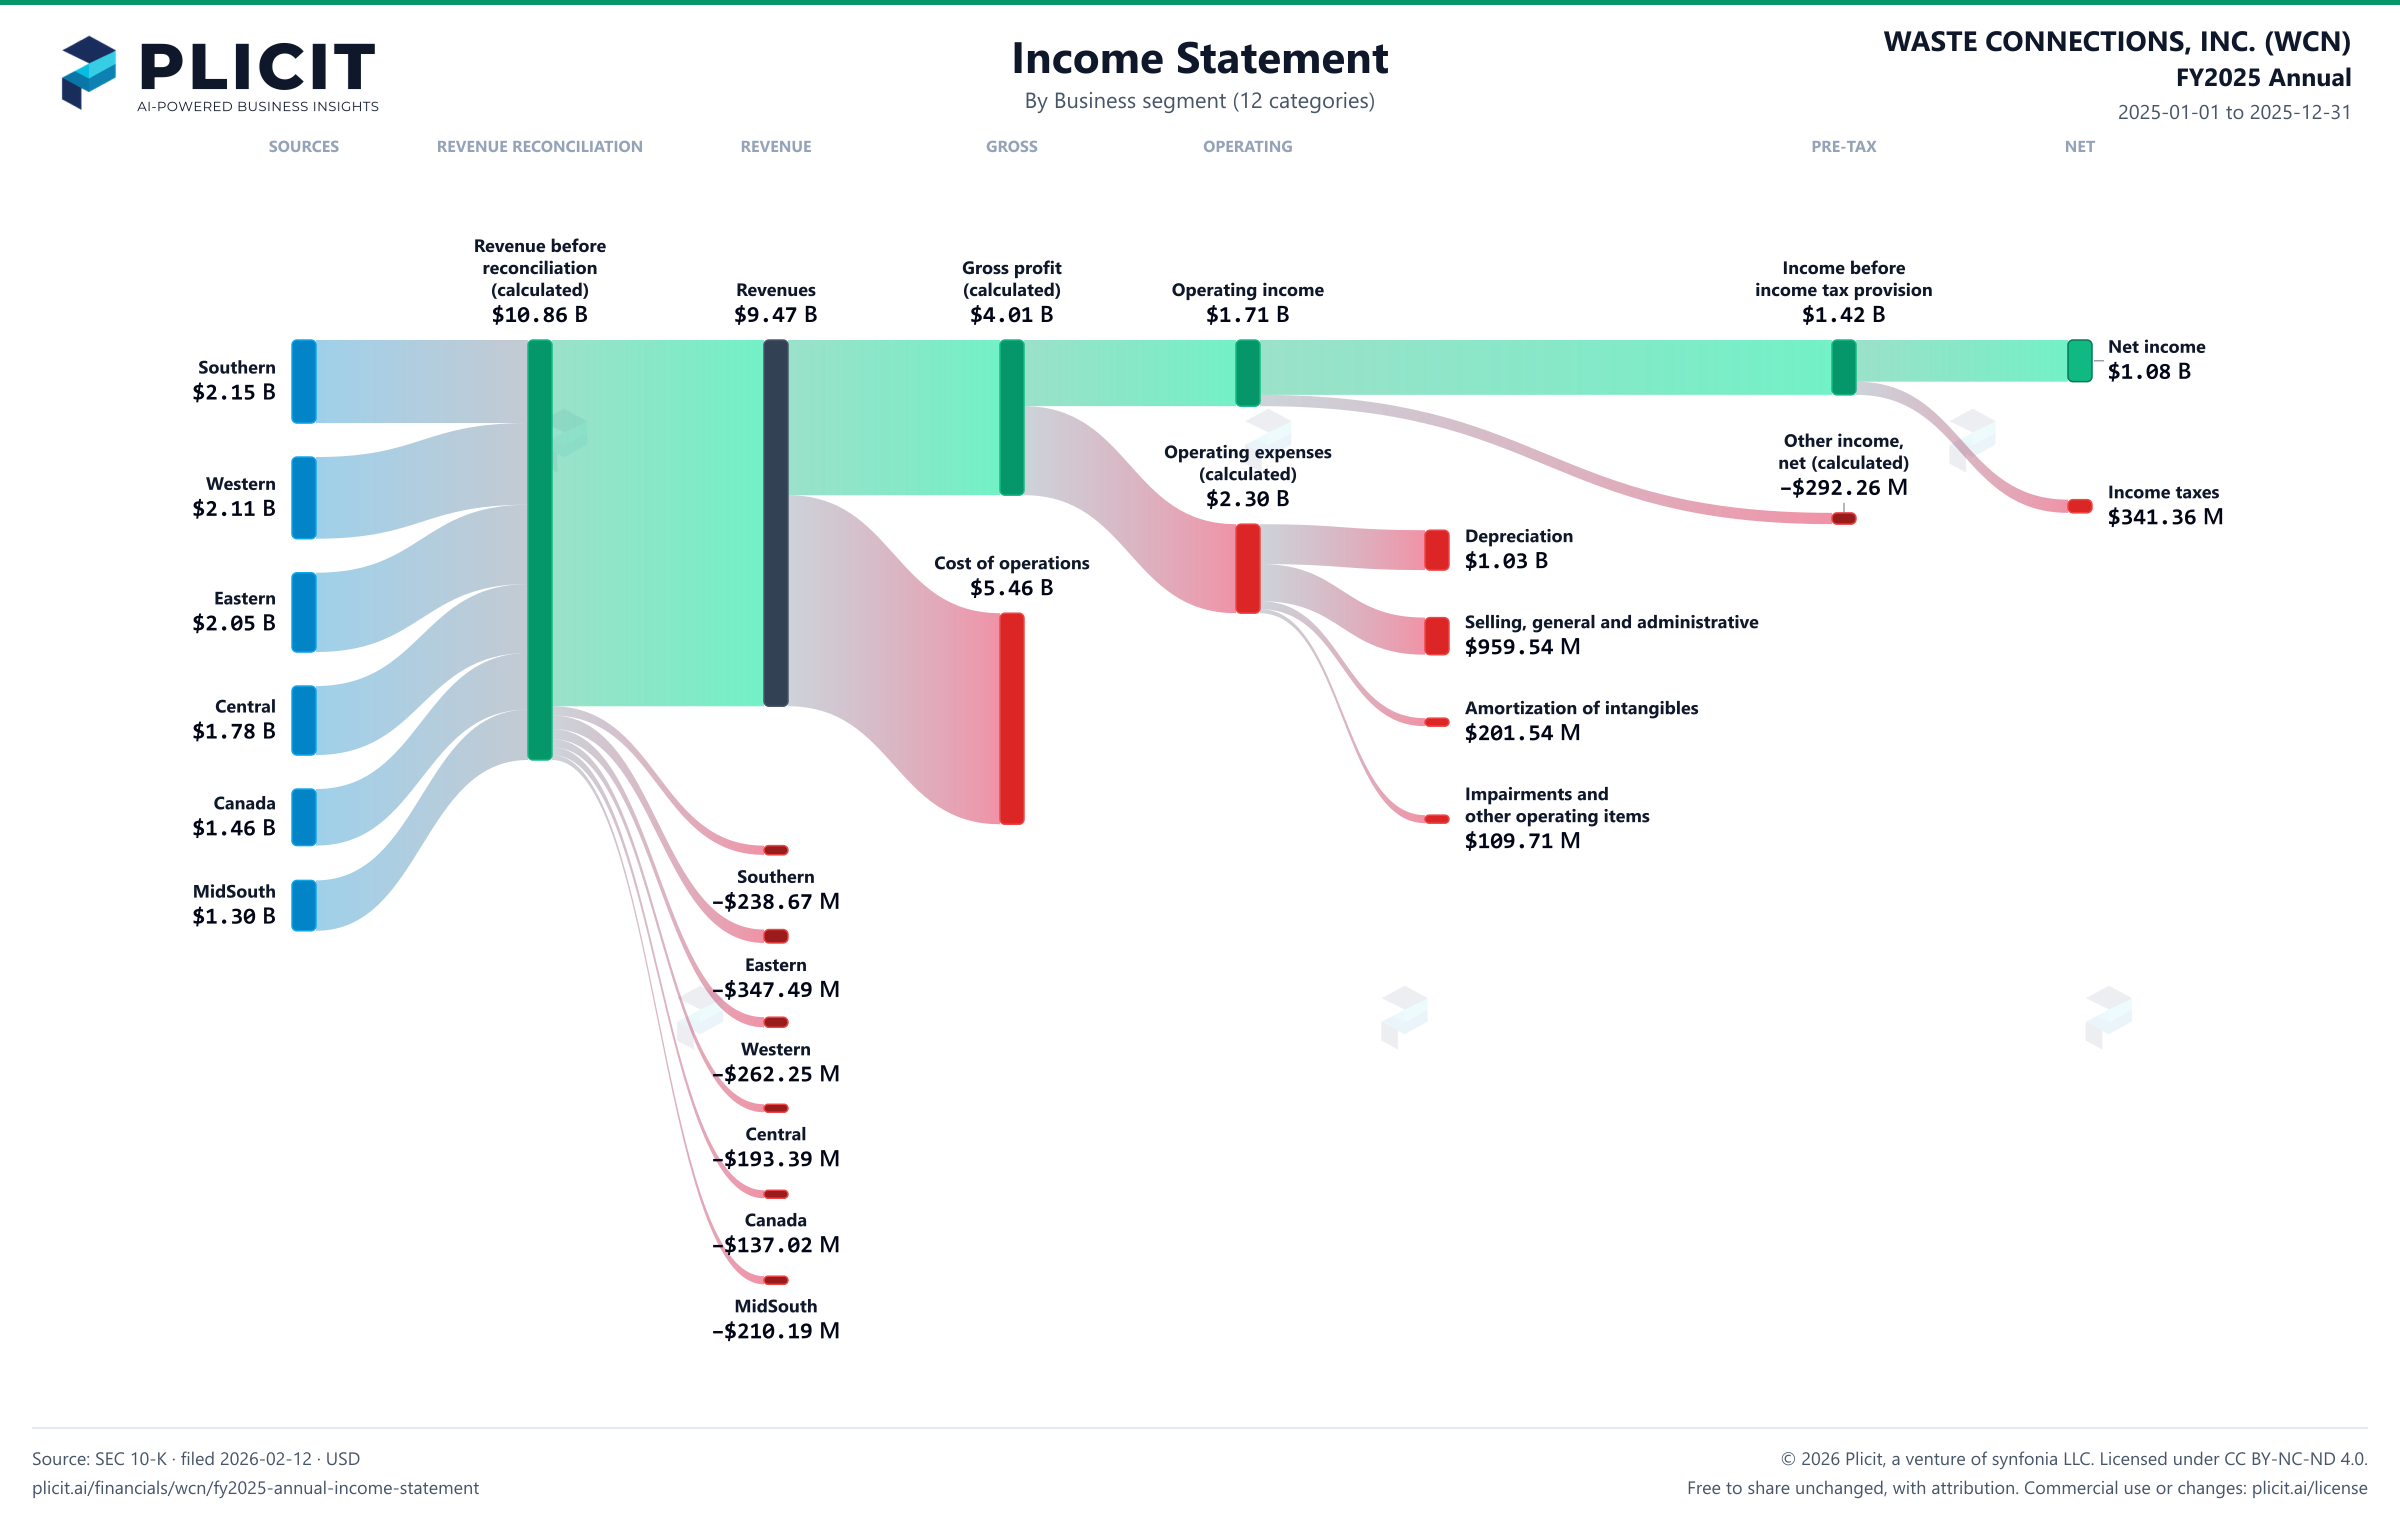
Free to share unchanged, with credit to Plicit.ai · CC BY-NC-ND 4.0Download PNG
Gross margin
42.4%
Gross profit / revenue
Operating margin
18.1%
Operating profit / revenue
Cash conversion
224.2%
Operating cash / net income, same period
Product waitlist
Health Check and Teardown for your own company
A health check uncovers insights of your private books, not a public ticker. Join this list to get notified as soon as we go-live!